3 months Premium FREE
No credit card. No commitment.
NN Group NV
🇳🇱 NN.AS · Amsterdam · NL0010773842
Insurance
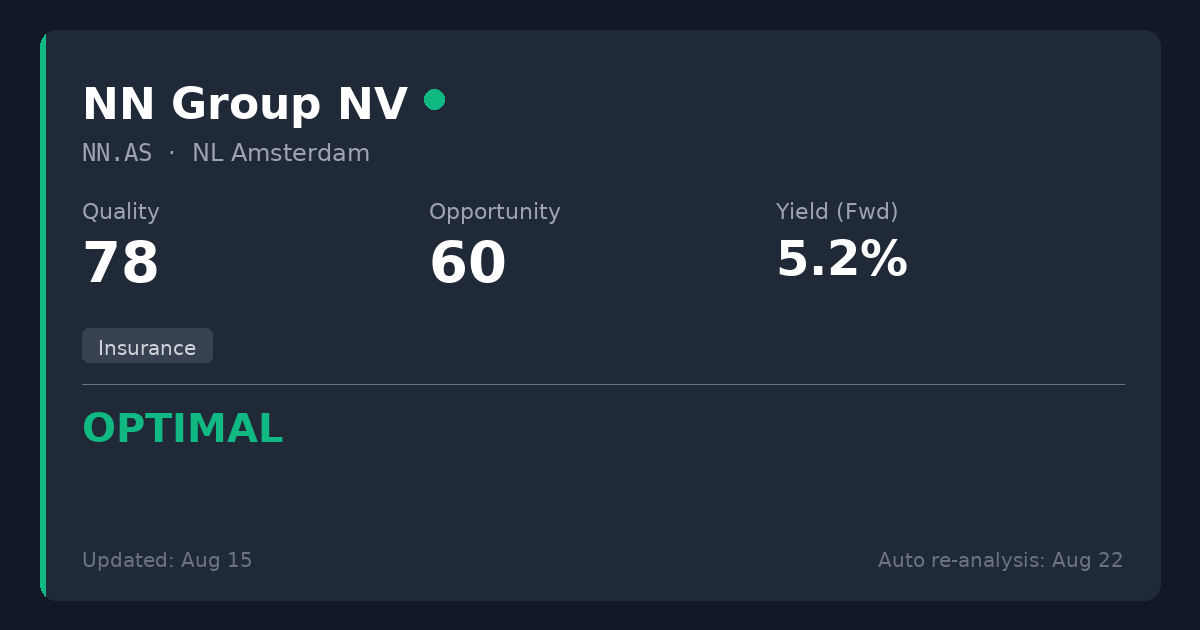
Scores
Key Metrics
Powered by EODHDP/E (TTM)
18.8
P/E (Price-to-Earnings)Shows how much investors pay for each $1 of profit. We display the TTM P/E (Trailing Twelve Months) which uses actual earnings from the last 4 quarters. This is more reliable than Forward P/E which uses analyst estimates.
Net Debt/EBITDA (TTM)
2.6x
Net Debt / EBITDAA leverage ratio showing how many years of EBITDA (earnings before interest, taxes, depreciation, and amortization) it would take to repay net debt. EBITDA approximates operating cash generation. Lower ratios (e.g., <3x) are generally safer; higher (e.g., >5x) may indicate more financial risk.
The quarterly value can spike when quarterly EBITDA is very low (e.g., one-time charges).
Quick guide: <2x manageable, >4x can be risky (sector-dependent).
ROE
8.8%
ROE (Return on Equity)A profitability measure: how much profit is generated from shareholders’ equity. Higher isn’t always better if it comes from high debt.
Dividend Summary
Powered by EODHDDividend Yield (Fwd)
5.18%
TTM: 5.18%
Dividend YieldThe Forward yield (Fwd) shows the next announced annual dividend / current price — what you'd earn going forward. The Trailing yield (TTM) in the tooltip shows dividends actually paid in the last 12 months. Forward is shown as primary because it reflects the company's current commitment to shareholders.
Forward Yield (estimated): 5.18%
Trailing Yield (TTM, last 12 months): 5.18%
Payout Ratio (Fwd)
146.7% TTM
Payout RatioDividends as a percentage of earnings. The Forward payout (Fwd) uses the announced dividend divided by actual past earnings (TTM) — it tells you if the company can afford what it promised. Very high payouts can be risky, especially if profits fall.
Announced dividend / actual earnings (TTM)
Dividend History
EODHD Dividends API| Status | Type | Decl. Date | Ex-Div Date | Pay Date | Currency | Amount |
|---|---|---|---|---|---|---|
| Forecast* | Interim | — | 10 Aug 2027 | — | EUR | 1.55 |
| Forecast* | Final | — | 25 May 2027 | — | EUR | 2.5 |
| Declared | Interim | 06 Aug 2026 | 10 Aug 2026 | 18 Aug 2026 | EUR | 1.55 |
| Paid | Final | 12 Feb 2026 | 25 May 2026 | 02 Jun 2026 | EUR | 2.5 |
* Extrapolated from past dividend history. Not an official announcement — treat as an estimate, not a confirmed date or amount.
Summary
NN Group is a dominant European insurer trading slightly below its net asset value while demonstrating exceptional capital strength with a 224% Solvency II ratio. The full resolution of the multi-billion-euro legacy litigation and a highly confident 14.4% declared dividend increase make this an elite DGI prospect. Worth considering for new positions.
Sector Context
NN Group is a dominant European life/non-life insurer and the market leader in Dutch pensions. In the insurance sector, traditional FCF and P/E metrics are heavily distorted by premium floats; therefore, Solvency II ratios, Price-to-Book, and operating capital generation are the primary indicators of dividend safety and underlying business health.
Temporary Opportunity Identified
The ongoing transition to the new Dutch Pension Reform (Wtp) creates heavy operational/IT burdens and temporarily depresses core ROE. However, the legacy Woekerpolis litigation risk is now fully resolved via a €360M settlement, clearing a major historical overhang.
📊 Strategy Analysis
- • Declared a massive +14.4% upcoming dividend raise (€3.54 to €4.05) and maintains an active buyback program, generating a strong 6.62% Total Shareholder Yield.
- • H1 operating capital generation beat expectations at €1.07B, backed by an incredibly robust Solvency II ratio of 224%.
- • Operating profit covers the dividend 2.88x, completely bypassing the distorted 146% TTM payout ratio typical of insurance accounting.
- • Trading slightly below Net Asset Value (P/B 0.98) with an attractive Forward P/E of 9.93x, offering excellent value.
⚠ What to Watch
- • The mandatory transition to the new Dutch Pension Reform (Wtp) by January 2028 introduces significant, ongoing IT system demands and operational complexity.
- • Return on Equity (ROE) remains moderate at 8.75%, though this marks a notable improvement from the ~5.6% seen in previous quarters.
- • TTM P/E is elevated at 18.83x due to transition and accounting volatility, though forward estimates normalize significantly.
📊 Historical Trends (10 Years)
Powered by EODHDThese charts show how key metrics have evolved over the past decade, helping you identify if the company is improving or deteriorating.
Debt Evolution (Net Debt / EBITDA)
Lower values are better. A declining trend indicates the company is reducing its debt (deleveraging).
Revenue & Earnings Growth
Consistent growth in revenueRevenue
The money a company brings in from selling its products or services. It’s the top line before costs. (blue) and earningsEarnings (Profit)
What’s left after expenses. Positive earnings mean the business made a profit; negative means a loss. (green) indicates a healthy business. Look for upward trends and recoveries after temporary dips.
Analysis date: 2026-08-15
Disclaimer: This information is for educational purposes only. Not financial advice.