3 months Premium FREE
No credit card. No commitment.
Farmers & Merchants Bancorp
🇺🇸 FMCB · NYSE/NASDAQ · US3077951040
Bank
USD 1431.85 price at analysis
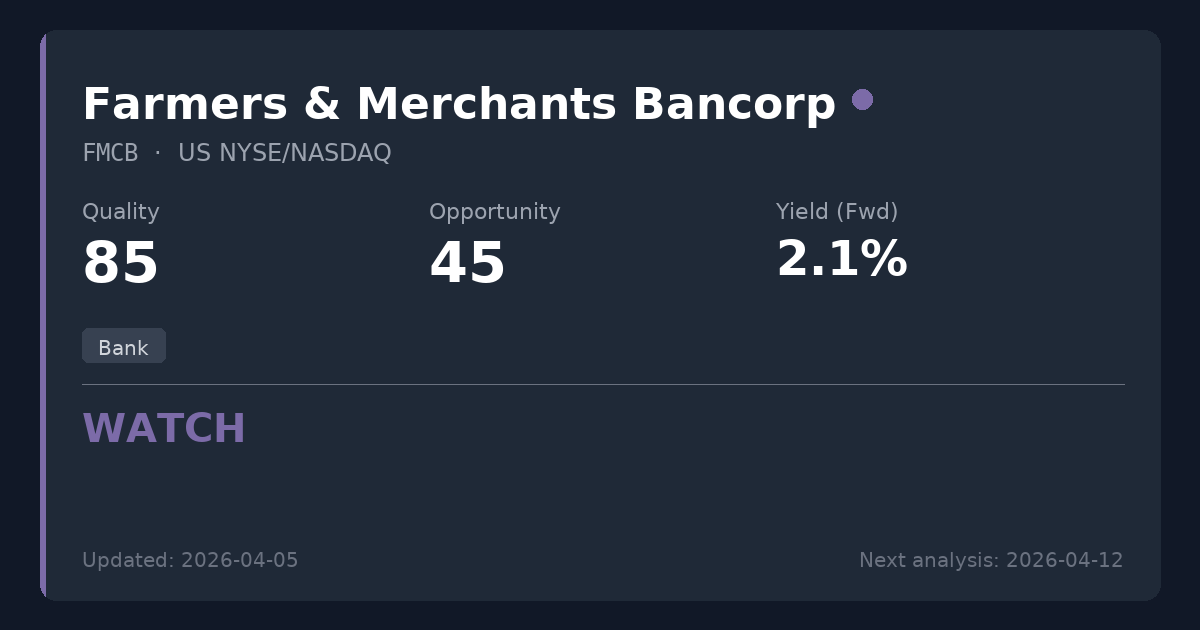
Scores
Key Metrics
Powered by EODHDP/E (TTM)
10.1
P/E (Price-to-Earnings)Shows how much investors pay for each $1 of profit. We display the TTM P/E (Trailing Twelve Months) which uses actual earnings from the last 4 quarters. This is more reliable than Forward P/E which uses analyst estimates.
Calculation: 1431.85 ÷ 137.49 = 10.1
TTM period through: 2026-06-30
Forward P/E (estimated): 11.1
Based on analyst estimates
Reference: Provider P/E (Trailing): 10.0
ROE
14.8%
ROE (Return on Equity)A profitability measure: how much profit is generated from shareholders’ equity. Higher isn’t always better if it comes from high debt.
Dividend Summary
Powered by EODHDDividend Yield (Fwd)
2.03%
TTM: 1.47%
Dividend YieldThe Forward yield (Fwd) shows the next announced annual dividend / current price — what you'd earn going forward. The Trailing yield (TTM) in the tooltip shows dividends actually paid in the last 12 months. Forward is shown as primary because it reflects the company's current commitment to shareholders.
Forward Yield (estimated): 2.03%
Trailing Yield (TTM, last 12 months): 1.47%
Payout Ratio (Fwd)
16.3%
TTM: 15.2%
Payout RatioDividends as a percentage of earnings. The Forward payout (Fwd) uses the announced dividend divided by actual past earnings (TTM) — it tells you if the company can afford what it promised. Very high payouts can be risky, especially if profits fall.
Announced dividend / actual earnings (TTM)
Payout (Fwd): 16.3%
Payout (TTM): 15.2%
Growth Streak
8 yrs
Consec. increases
Div. Growth (5Y)
5.6%
Dividend History
EODHD Dividends API| Status | Type | Decl. Date | Ex-Div Date | Pay Date | Currency | Amount |
|---|---|---|---|---|---|---|
| Forecast* | Quarterly | — | 12 Jun 2027 | — | USD | 5.35 |
| Forecast* | Quarterly | — | 11 Mar 2027 | — | USD | 5.1 |
| Forecast* | Quarterly | — | 15 Dec 2026 | — | USD | 5.05 |
| Declared | Quarterly | 12 Aug 2026 | 11 Sep 2026 | 01 Oct 2026 | USD | 5.6 |
| Paid | Quarterly | 12 May 2026 | 12 Jun 2026 | 01 Jul 2026 | USD | 5.35 |
| Paid | Quarterly | 12 Feb 2026 | 11 Mar 2026 | 01 Apr 2026 | USD | 5.1 |
| Paid | Quarterly | 12 Nov 2025 | 15 Dec 2025 | 02 Jan 2026 | USD | 5.05 |
| Paid | Quarterly | 12 Aug 2025 | 11 Sep 2025 | 01 Oct 2025 | USD | 5 |
* Extrapolated from past dividend history. Not an official announcement — treat as an estimate, not a confirmed date or amount.
Summary
Farmers & Merchants Bancorp is an exceptionally well-capitalized regional bank and a premier agricultural lender with a strong track record of earnings growth. Although the 1.55% forward yield is low for immediate income seekers, an attractive 10.14x P/E, large buybacks, and an upcoming 11.9% dividend hike make it a compelling compounder. Worth considering for new positions where total shareholder return is prioritized over immediate high yield.
Sector Context
Regional Banks. While the sector broadly faces deposit pressures and strict new capital requirements, FMCB's robust CET1 capital ratio and deep localized moat in California's Central Valley agricultural lending offer significant structural advantages over larger, generic competitors.
📊 Strategy Analysis
- • Excellent profitability for a regional bank with an ROE of 14.85% and exceptionally low debt-to-equity (0.02).
- • Confirmed upcoming 11.9% dividend raise, supported by a very low forward payout ratio (16.29%).
- • Attractive valuation at a 10.14x TTM P/E, which is highly compelling given a 10-year revenue CAGR of 7.8%.
- • Strong total shareholder yield of 4.55%, substantially bolstered by a 3.08% net buyback yield.
⚠ What to Watch
- • Forward dividend yield of 1.55% falls significantly below the traditional DGI 3% threshold, limiting immediate income generation.
- • California's Sustainable Groundwater Management Act (SGMA) presents a long-term structural risk to the agricultural land values securing the bank's specialized loan portfolio.
📊 Historical Trends (10 Years)
Powered by EODHDThese charts show how key metrics have evolved over the past decade, helping you identify if the company is improving or deteriorating.
Debt Evolution (Net Debt / EBITDA)
Lower values are better. A declining trend indicates the company is reducing its debt (deleveraging).
Revenue & Earnings Growth
Consistent growth in revenueRevenue
The money a company brings in from selling its products or services. It’s the top line before costs. (blue) and earningsEarnings (Profit)
What’s left after expenses. Positive earnings mean the business made a profit; negative means a loss. (green) indicates a healthy business. Look for upward trends and recoveries after temporary dips.
Analysis date: 2026-08-15
Disclaimer: This information is for educational purposes only. Not financial advice.