3 months Premium FREE
No credit card. No commitment.
Blackstone Group Inc
🇺🇸 BX · NYSE/NASDAQ
Bank
Price at analysis: USD 119.56 Current price: USD 121.88 * updated every night
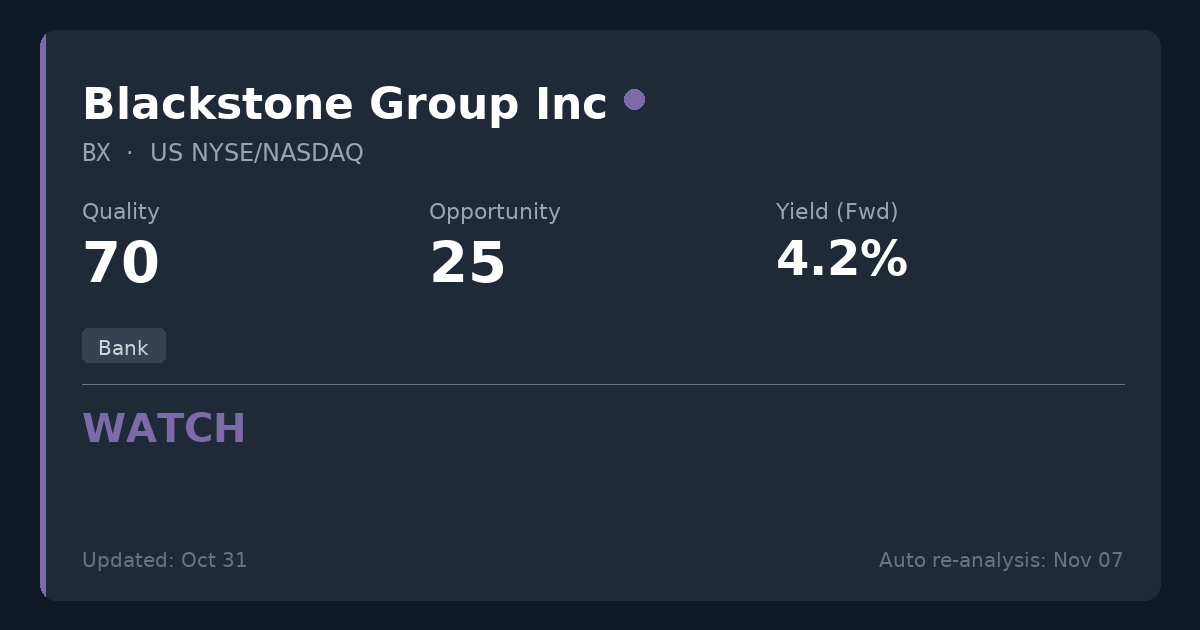
Scores
Key Metrics
Powered by EODHDP/E (TTM)
26.4
P/E (Price-to-Earnings)Shows how much investors pay for each $1 of profit. We display the TTM P/E (Trailing Twelve Months) which uses actual earnings from the last 4 quarters. This is more reliable than Forward P/E which uses analyst estimates.
Net Debt/EBITDA (TTM)
1.3x
Latest quarter: 6.5x
Net Debt / EBITDAA leverage ratio showing how many years of EBITDA (earnings before interest, taxes, depreciation, and amortization) it would take to repay net debt. EBITDA approximates operating cash generation. Lower ratios (e.g., <3x) are generally safer; higher (e.g., >5x) may indicate more financial risk.
Latest quarter (2026-09-30): 6.5x
The quarterly value can spike when quarterly EBITDA is very low (e.g., one-time charges).
Quick guide: <2x manageable, >4x can be risky (sector-dependent).
ROE
32.4%
ROE (Return on Equity)A profitability measure: how much profit is generated from shareholders’ equity. Higher isn’t always better if it comes from high debt.
EV/EBITDA
15.7x
EV/EBITDAA valuation ratio that compares total business value (including debt) to EBITDA. Lower can mean cheaper, but context matters.
Dividend Summary
Powered by EODHDDividend Yield (Fwd)
4.23%
TTM: 4.32%
Dividend YieldThe Forward yield (Fwd) shows the next announced annual dividend / current price — what you'd earn going forward. The Trailing yield (TTM) in the tooltip shows dividends actually paid in the last 12 months. Forward is shown as primary because it reflects the company's current commitment to shareholders.
Forward Yield (estimated): 4.23%
Trailing Yield (TTM, last 12 months): 4.32%
Payout Ratio (Fwd)
85.0% TTM
Payout RatioDividends as a percentage of earnings. The Forward payout (Fwd) uses the announced dividend divided by actual past earnings (TTM) — it tells you if the company can afford what it promised. Very high payouts can be risky, especially if profits fall.
Announced dividend / actual earnings (TTM)
Dividend History
EODHD Dividends API| Status | Type | Decl. Date | Ex-Div Date | Pay Date | Currency | Amount |
|---|---|---|---|---|---|---|
| Forecast* | Quarterly | — | 02 Nov 2027 | — | USD | 1.12 |
| Forecast* | Quarterly | — | 03 Aug 2027 | — | USD | 1.29 |
| Forecast* | Quarterly | — | 28 Apr 2027 | — | USD | 0.93 |
| Forecast* | Quarterly | — | 09 Feb 2027 | — | USD | 1.49 |
| Declared | Quarterly | 20 Oct 2026 | 02 Nov 2026 | 09 Nov 2026 | USD | 1.12 |
| Paid | Quarterly | 21 Jul 2026 | 03 Aug 2026 | 10 Aug 2026 | USD | 1.29 |
| Paid | Quarterly | 21 Apr 2026 | 04 May 2026 | 11 May 2026 | USD | 1.16 |
| Paid | Quarterly | 29 Jan 2026 | 09 Feb 2026 | 17 Feb 2026 | USD | 1.49 |
* Extrapolated from past dividend history. Not an official announcement — treat as an estimate, not a confirmed date or amount.
² Type not provided by EODHD — inferred from historical payment data.
Summary
Blackstone is an elite alternative asset manager with an extraordinary 32.4% ROE and a dominant $1.4 trillion AUM scale. While recent legal and regulatory overhangs have been favorably resolved, the company's inherently variable dividend policy—which explicitly justifies the payout cuts seen in 2019 and 2023—and premium ~26x P/E valuation limit its immediate appeal. Existing holders should maintain this high-quality franchise, but new investors should wait for a broader market pullback.
Sector Context
Asset managers operate in the financial sector, where scale, distribution, and regulatory compliance infrastructure act as major competitive moats. For DGI investors, alternative asset managers often utilize variable dividend policies tied to distributable earnings, requiring a tolerance for fluctuating payouts.
Temporary Opportunity Identified
Lower investment realization activity over the past year has temporarily suppressed distributable earnings and dividend payouts, though AUM inflows remain at record highs.
📊 Strategy Analysis
- • Elite competitive moat as the world's largest alternative asset manager ($1.4T AUM) driving an outstanding 32.38% ROE.
- • Major regulatory and legal overhangs have been favorably resolved, including the vacatur of the SEC Private Fund Adviser Rules and settlement of the Kentucky pension litigation.
- • Strong structural tailwinds from Basel III banking regulations are pushing market share toward alternative private credit lenders like Blackstone.
- • Management declared an upcoming 7.9% dividend increase for 2026, signaling confidence in forward distributable earnings recovery.
⚠ What to Watch
- • Premium valuation with a TTM P/E of 26.42x offers virtually no margin of safety for new capital entry.
- • The variable dividend policy, which targets ~85% of distributable earnings, resulted in explicitly justified strategic cuts in 2019 and 2023, making income unpredictable for strict DGI portfolios.
- • Long-term structural regulatory risk remains regarding ongoing legislative debates over carried interest tax treatment.
📊 Historical Trends (10 Years)
Powered by EODHDThese charts show how key metrics have evolved over the past decade, helping you identify if the company is improving or deteriorating.
Debt Evolution (Net Debt / EBITDA)
Lower values are better. A declining trend indicates the company is reducing its debt (deleveraging).
Revenue & Earnings Growth
Consistent growth in revenueRevenue
The money a company brings in from selling its products or services. It’s the top line before costs. (blue) and earningsEarnings (Profit)
What’s left after expenses. Positive earnings mean the business made a profit; negative means a loss. (green) indicates a healthy business. Look for upward trends and recoveries after temporary dips.
Analysis date: 2026-10-31
Disclaimer: This information is for educational purposes only. Not financial advice.