3 months Premium FREE
No credit card. No commitment.
Air Products and Chemicals Inc
🇺🇸 APD · NYSE/NASDAQ
Materials
Price at analysis: USD 298.10 Current price: USD 294.56 * updated every night
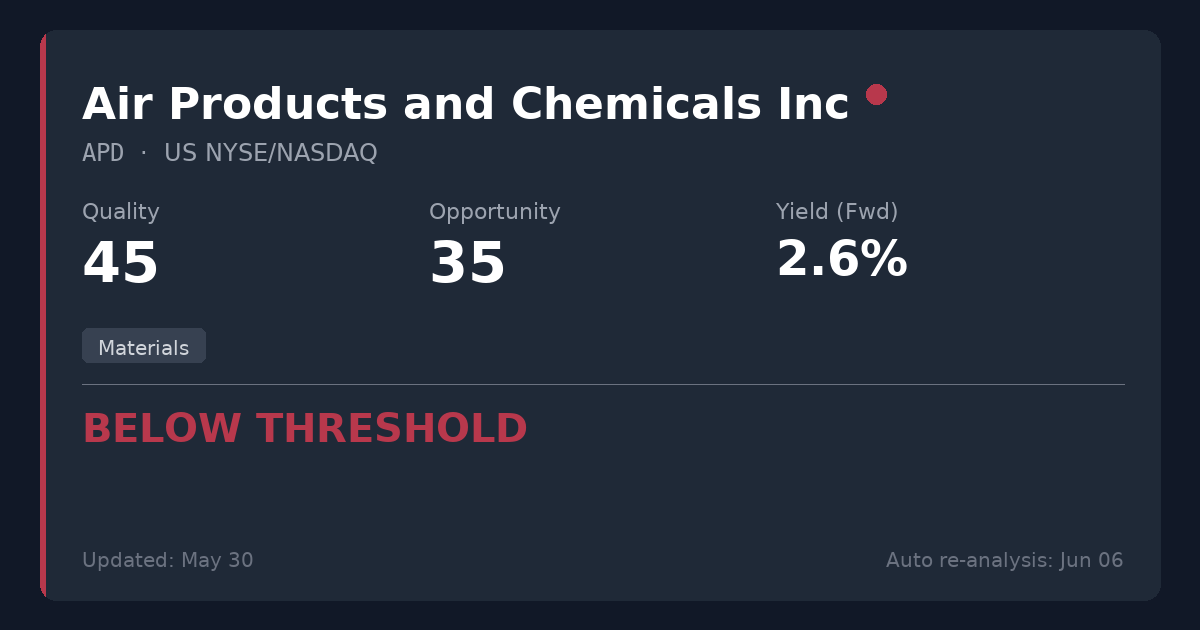
Scores
Key Metrics
Powered by EODHDP/E (TTM)
N/A
P/E (Price-to-Earnings)Shows how much investors pay for each $1 of profit. We display the TTM P/E (Trailing Twelve Months) which uses actual earnings from the last 4 quarters. This is more reliable than Forward P/E which uses analyst estimates.
TTM period through: 2026-06-30
Why N/A?
EPS (TTM) = -0.22 (negative or zero)
Cannot calculate P/E with negative earnings.
Forward P/E (estimated): 19.9
Based on analyst estimates
Reference: Provider P/E (Forward): 19.9
Net Debt/EBITDA (TTM)
3.9x
Latest quarter: 14.4x
Net Debt / EBITDAA leverage ratio showing how many years of EBITDA (earnings before interest, taxes, depreciation, and amortization) it would take to repay net debt. EBITDA approximates operating cash generation. Lower ratios (e.g., <3x) are generally safer; higher (e.g., >5x) may indicate more financial risk.
TTM through: 2026-06-30
Latest quarter (2026-06-30): 14.4x
The quarterly value can spike when quarterly EBITDA is very low (e.g., one-time charges).
Quick guide: <2x manageable, >4x can be risky (sector-dependent).
ROE
16.9%
ROE (Return on Equity)A profitability measure: how much profit is generated from shareholders’ equity. Higher isn’t always better if it comes from high debt.
EV/EBITDA
48.2x
EV/EBITDAA valuation ratio that compares total business value (including debt) to EBITDA. Lower can mean cheaper, but context matters.
Dividend Summary
Powered by EODHDDividend Yield (Fwd)
2.58%
TTM: 2.46%
Dividend YieldThe Forward yield (Fwd) shows the next announced annual dividend / current price — what you'd earn going forward. The Trailing yield (TTM) in the tooltip shows dividends actually paid in the last 12 months. Forward is shown as primary because it reflects the company's current commitment to shareholders.
Forward Yield (estimated): 2.58%
Trailing Yield (TTM, last 12 months): 2.46%
Payout Ratio (Fwd)
54.6% TTM
Payout RatioDividends as a percentage of earnings. The Forward payout (Fwd) uses the announced dividend divided by actual past earnings (TTM) — it tells you if the company can afford what it promised. Very high payouts can be risky, especially if profits fall.
Announced dividend / actual earnings (TTM)
Cash Flow Payout (TTM): 35.0%
FCF Coverage (TTM): 1.29x
Growth Streak
1 yrs
Consec. increases
Div. Growth (5Y)
5.9%
Dividend History
EODHD Dividends API| Status | Type | Decl. Date | Ex-Div Date | Pay Date | Currency | Amount |
|---|---|---|---|---|---|---|
| Forecast* | Quarterly | — | 01 Oct 2027 | — | USD | 1.81 |
| Forecast* | Quarterly | — | 01 Jul 2027 | — | USD | 1.81 |
| Forecast* | Quarterly | — | 01 Apr 2027 | — | USD | 1.81 |
| Forecast* | Quarterly | — | 02 Jan 2027 | — | USD | 1.79 |
| Declared | Quarterly | 22 Jul 2026 | 01 Oct 2026 | 09 Nov 2026 | USD | 1.81 |
| Paid | Quarterly | 23 Apr 2026 | 01 Jul 2026 | 10 Aug 2026 | USD | 1.81 |
| Paid | Quarterly | 27 Jan 2026 | 01 Apr 2026 | 11 May 2026 | USD | 1.81 |
| Paid | Quarterly | 19 Nov 2025 | 02 Jan 2026 | 09 Feb 2026 | USD | 1.79 |
* Extrapolated from past dividend history. Not an official announcement — treat as an estimate, not a confirmed date or amount.
Summary
Air Products benefits from an entrenched industrial gas oligopoly and has favorably resolved recent legal overhangs, but its massive, high-risk capital pivot toward unproven clean hydrogen has resulted in severe capital destruction. Not recommended for new positions, as the expensive Forward P/E of 19.92x offers poor compensation for the weakened balance sheet and tight free cash flow coverage.
Sector Context
Air Products operates in the Materials sector as a Specialty Chemicals provider, specifically dominating the highly consolidated industrial gas market. While the core business model is a wide-moat oligopoly essential to manufacturing, the capital-intensive nature and cyclicality of its customer base warrant a slight DGI strategy fit penalty compared to pure essential services.
Temporary Opportunity Identified
The company reported severe net losses recently due to approximately $2.9 billion in pre-tax charges associated with the cancellation and write-down of several major clean energy and hydrogen projects.
📊 Strategy Analysis
- • Beneficial resolutions of the World Energy litigation and Brazilian antitrust fine eliminate significant legal overhangs
- • Core earnings growth remains historically stable, exhibiting an ex-loss 8-year EPS CAGR of 25.3%
- • Recent net losses are clearly temporary, driven by $2.9B in one-time pre-tax charges to responsibly exit unviable clean energy projects
⚠ What to Watch
- • Massive capital destruction from the clean hydrogen pivot has strained the balance sheet, pushing Net Debt/EBITDA to 3.92x
- • Valuation offers no margin of safety with an expensive Forward P/E of 19.92x and a high EV/EBITDA of 48.18x
- • Free cash flow dividend coverage is relatively tight at 1.29x, which limits dividend growth potential while leverage is high
📊 Historical Trends (10 Years)
Powered by EODHDThese charts show how key metrics have evolved over the past decade, helping you identify if the company is improving or deteriorating.
Debt Evolution (Net Debt / EBITDA)
Lower values are better. A declining trend indicates the company is reducing its debt (deleveraging).
Revenue & Earnings Growth
Consistent growth in revenueRevenue
The money a company brings in from selling its products or services. It’s the top line before costs. (blue) and earningsEarnings (Profit)
What’s left after expenses. Positive earnings mean the business made a profit; negative means a loss. (green) indicates a healthy business. Look for upward trends and recoveries after temporary dips.
Dividend Sustainability (FCF vs Dividends Paid)
Free cash flowFree Cash Flow
Cash left after the company pays for running the business and maintaining it. Often used to fund dividends, pay debt, or buy back shares. (FCFFCF (Free Cash Flow)
Short for Free Cash Flow: cash left after operating needs and maintenance spending., blue) should cover dividends paidDividends Paid
Cash the company paid out to shareholders. It’s not guaranteed and can change over time. (green). If dividends consistently exceed FCFFCF (Free Cash Flow)
Short for Free Cash Flow: cash left after operating needs and maintenance spending., the dividend may be at risk.
Analysis date: 2026-10-17
Disclaimer: This information is for educational purposes only. Not financial advice.