3 months Premium FREE
No credit card. No commitment.
WEC Energy Group Inc
🇺🇸 WEC · NYSE/NASDAQ · US92939U1060
Utilities
Price at analysis: USD 106.25 Current price: USD 106.19 * updated every night
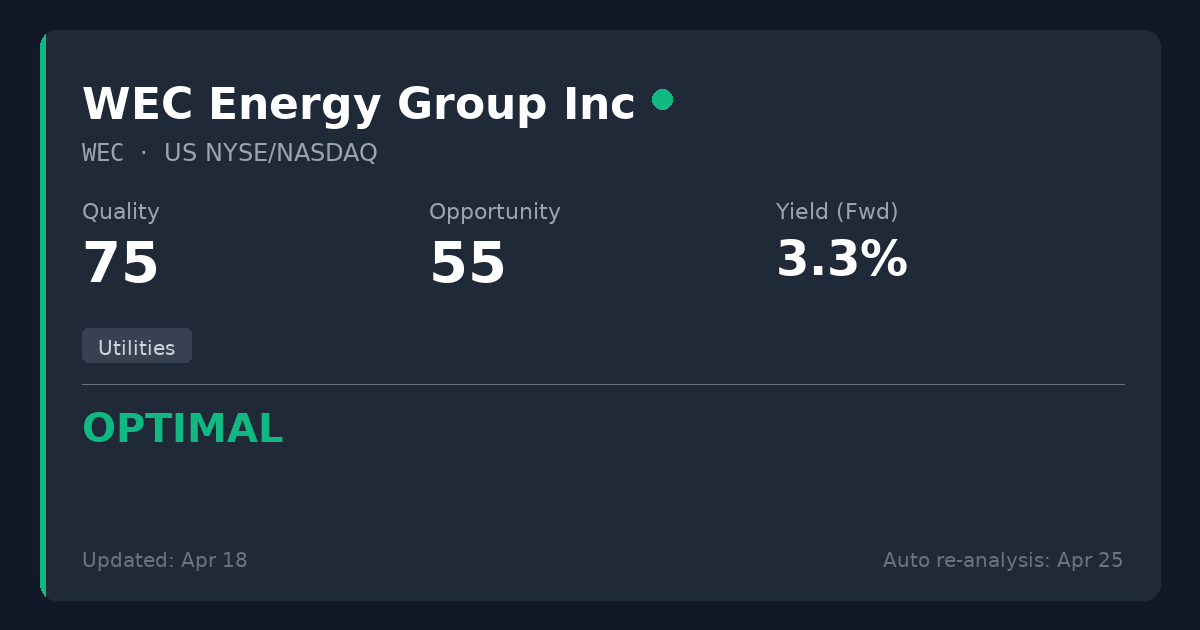
Scores
Key Metrics
Powered by EODHDP/E (TTM)
20.6
P/E (Price-to-Earnings)Shows how much investors pay for each $1 of profit. We display the TTM P/E (Trailing Twelve Months) which uses actual earnings from the last 4 quarters. This is more reliable than Forward P/E which uses analyst estimates.
Net Debt/EBITDA (TTM)
5.6x
Latest quarter: 28.0x
Net Debt / EBITDAA leverage ratio showing how many years of EBITDA (earnings before interest, taxes, depreciation, and amortization) it would take to repay net debt. EBITDA approximates operating cash generation. Lower ratios (e.g., <3x) are generally safer; higher (e.g., >5x) may indicate more financial risk.
Latest quarter (2026-06-30): 28.0x
The quarterly value can spike when quarterly EBITDA is very low (e.g., one-time charges).
Quick guide: <2x manageable, >4x can be risky (sector-dependent).
ROE
12.0%
ROE (Return on Equity)A profitability measure: how much profit is generated from shareholders’ equity. Higher isn’t always better if it comes from high debt.
EV/EBITDA
13.7x
EV/EBITDAA valuation ratio that compares total business value (including debt) to EBITDA. Lower can mean cheaper, but context matters.
Dividend Summary
Powered by EODHDDividend Yield (Fwd)
3.29%
TTM: 3.43%
Dividend YieldThe Forward yield (Fwd) shows the next announced annual dividend / current price — what you'd earn going forward. The Trailing yield (TTM) in the tooltip shows dividends actually paid in the last 12 months. Forward is shown as primary because it reflects the company's current commitment to shareholders.
Forward Yield (estimated): 3.29%
Trailing Yield (TTM, last 12 months): 3.43%
Payout Ratio (Fwd)
66.8% TTM
Payout RatioDividends as a percentage of earnings. The Forward payout (Fwd) uses the announced dividend divided by actual past earnings (TTM) — it tells you if the company can afford what it promised. Very high payouts can be risky, especially if profits fall.
Announced dividend / actual earnings (TTM)
Dividend History
EODHD Dividends API| Status | Type | Decl. Date | Ex-Div Date | Pay Date | Currency | Amount |
|---|---|---|---|---|---|---|
| Forecast* | Quarterly | — | 14 Aug 2027 | — | USD | 0.9525 |
| Forecast* | Quarterly | — | 14 May 2027 | — | USD | 0.9525 |
| Forecast* | Quarterly | — | 13 Feb 2027 | — | USD | 0.9525 |
| Forecast* | Quarterly | — | 14 Nov 2026 | — | USD | 0.8925 |
| Paid | Quarterly | 16 Jul 2026 | 14 Aug 2026 | 01 Sep 2026 | USD | 0.9525 |
| Paid | Quarterly | 16 Apr 2026 | 14 May 2026 | 01 Jun 2026 | USD | 0.9525 |
| Paid | Quarterly | 04 Dec 2025 | 13 Feb 2026 | 01 Mar 2026 | USD | 0.9525 |
| Paid | Quarterly | 16 Oct 2025 | 14 Nov 2025 | 01 Dec 2025 | USD | 0.8925 |
* Extrapolated from past dividend history. Not an official announcement — treat as an estimate, not a confirmed date or amount.
Summary
WEC Energy Group is a premium regulated utility offering a highly reliable monopoly business model and consistent dividend growth. While near-term regulatory hurdles in Illinois and funding requirements for a $37.5 billion capital plan weigh on cash flow and require some equity dilution, the company's long-term rate base growth remains completely intact. Worth considering for new positions as a core defensive holding for dividend investors.
Sector Context
WEC Energy Group operates as a regulated utility, providing essential electricity and natural gas. In a DGI strategy, utilities are foundational defensive holdings that offer reliable, regulated earnings and consistent dividend growth. They naturally carry higher debt loads and operate with negative free cash flow due to continuous, mandated infrastructure investments, which are eventually recovered through regulated rate hikes.
Temporary Opportunity Identified
Near-term regulatory friction from the expiration of the Illinois QIP rider and associated capex disallowances, combined with broader market fears over higher interest rates (Fed hawkishness), have temporarily pressured the valuation.
📊 Strategy Analysis
- • Irreplaceable regulated monopoly providing essential electric and gas services, trading at an attractive P/FFO of 10.49.
- • Consistent dividend growth profile with an 8-year consecutive increase streak, a 7.1% 5-year CAGR, and a solid forward yield of 3.53%.
- • Extensive $37.5 billion capital plan focused on renewables and data center demand secures strong long-term rate base and earnings growth.
- • Stable profitability metrics for a utility, featuring an 11.99% ROE and a highly manageable forward payout ratio of 73.83%.
⚠ What to Watch
- • Expiration of the Illinois QIP rider and a recent settlement involving $350 million in capex disallowances introduce near-term regulatory lag and margin pressure.
- • Heavy capital expenditure requirements are driving negative free cash flow (-$269.7 million) and necessitating equity dilution, as evidenced by the -4.53% net buyback yield.
- • Persistent structural environmental liabilities, including a $474.3 million accrued reserve for legacy Manufactured Gas Plant (MGP) and coal ash cleanup.
📊 Historical Trends (10 Years)
Powered by EODHDThese charts show how key metrics have evolved over the past decade, helping you identify if the company is improving or deteriorating.
Debt Evolution (Net Debt / EBITDA)
Lower values are better. A declining trend indicates the company is reducing its debt (deleveraging).
Revenue & Earnings Growth
Consistent growth in revenueRevenue
The money a company brings in from selling its products or services. It’s the top line before costs. (blue) and earningsEarnings (Profit)
What’s left after expenses. Positive earnings mean the business made a profit; negative means a loss. (green) indicates a healthy business. Look for upward trends and recoveries after temporary dips.
Dividend Sustainability (FCF vs Dividends Paid)
Free cash flowFree Cash Flow
Cash left after the company pays for running the business and maintaining it. Often used to fund dividends, pay debt, or buy back shares. (FCFFCF (Free Cash Flow)
Short for Free Cash Flow: cash left after operating needs and maintenance spending., blue) should cover dividends paidDividends Paid
Cash the company paid out to shareholders. It’s not guaranteed and can change over time. (green). If dividends consistently exceed FCFFCF (Free Cash Flow)
Short for Free Cash Flow: cash left after operating needs and maintenance spending., the dividend may be at risk.
Analysis date: 2026-08-29
Disclaimer: This information is for educational purposes only. Not financial advice.