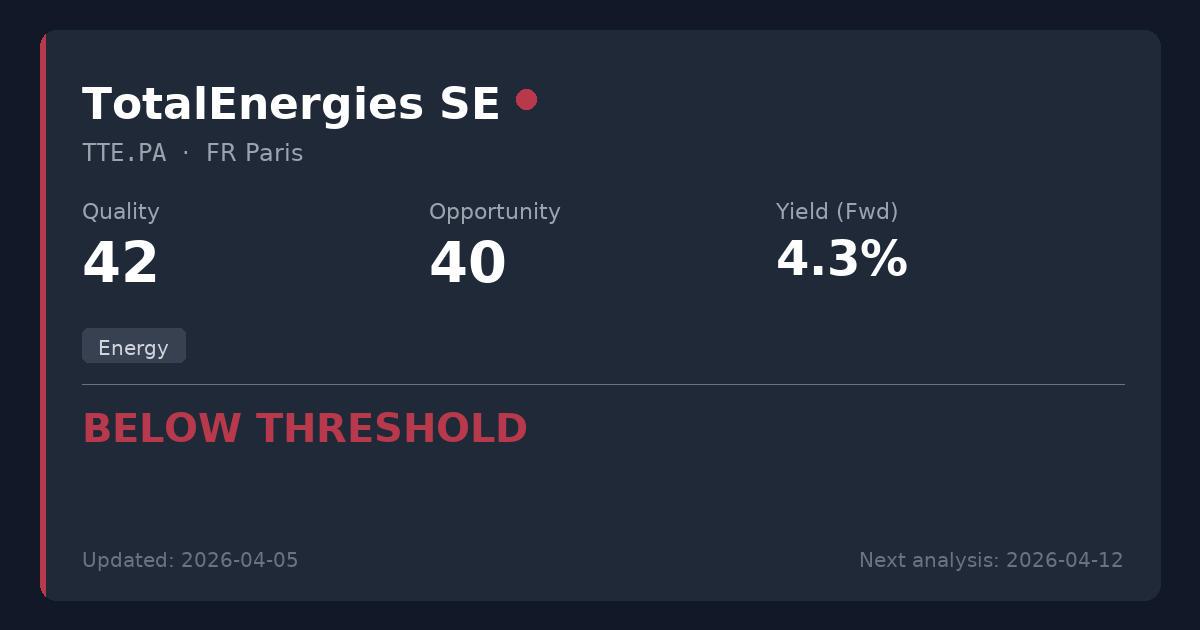
TotalEnergies SE
🇫🇷 TTE.PA · Paris · FR0000120271
Energy
EUR 79.42 price at analysis
Scores
Key Metrics
Powered by EODHDP/E (TTM)
12.9
P/E (Price-to-Earnings)Shows how much investors pay for each $1 of profit. We display the TTM P/E (Trailing Twelve Months) which uses actual earnings from the last 4 quarters. This is more reliable than Forward P/E which uses analyst estimates.
Calculation: 79.42 ÷ 6.17 = 12.9
TTM period through: 2025-12-31
Forward P/E (estimated): 13.4
Based on analyst estimates
Reference: Provider P/E (Trailing): 15.9
Yield (Fwd)
4.28%
Dividend YieldThe Forward yield (Fwd) shows the next announced annual dividend / current price — what you'd earn going forward. The Trailing yield (TTM) in the tooltip shows dividends actually paid in the last 12 months. Forward is shown as primary because it reflects the company's current commitment to shareholders.
Trailing Yield (TTM): 5.15%
Net Debt/EBITDA (TTM)
1.0x
Latest quarter: 4.2x
Net Debt / EBITDAA leverage ratio showing how many years of EBITDA (earnings before interest, taxes, depreciation, and amortization) it would take to repay net debt. EBITDA approximates operating cash generation. Lower ratios (e.g., <3x) are generally safer; higher (e.g., >5x) may indicate more financial risk.
TTM through: 2025-12-31
Latest quarter (2025-12-31): 4.2x
The quarterly value can spike when quarterly EBITDA is very low (e.g., one-time charges).
Quick guide: <2x manageable, >4x can be risky (sector-dependent).
Payout (Fwd)
55.1%
Payout RatioDividends as a percentage of earnings. The Forward payout (Fwd) uses the announced dividend divided by actual past earnings (TTM) — it tells you if the company can afford what it promised. Very high payouts can be risky, especially if profits fall.
Announced dividend / actual earnings (TTM)
Payout (TTM): 61.9%
Cash Flow Payout (TTM): 29.7%
FCF Coverage (TTM): 1.28x
ROE
11.2%
ROE (Return on Equity)A profitability measure: how much profit is generated from shareholders’ equity. Higher isn’t always better if it comes from high debt.
EV/EBITDA
5.9x
EV/EBITDAA valuation ratio that compares total business value (including debt) to EBITDA. Lower can mean cheaper, but context matters.
Summary
TotalEnergies is currently generating massive cash flows due to cyclical peak oil prices driven by Middle East conflicts. However, the structural long-term energy transition risks and an upcoming proposed dividend cut make this a poor fit for conservative dividend strategies. Not recommended for new positions, as better risk-adjusted opportunities exist in more stable, non-cyclical essential services.
Sector Context
TotalEnergies is a global integrated energy major involved in oil and gas production, refining, and power generation. The energy sector is inherently cyclical, meaning the best entry points for dividend investors typically emerge during commodity price crashes rather than during geopolitical crises that inflate short-term earnings.
📊 Strategy Analysis
- • Maintains a highly robust balance sheet with Net Debt/EBITDA of 0.98x and a low Cash Flow Payout of 29.7%.
- • Currently generating exceptional cash flows and trading profits driven by cyclical peak oil prices above $100 per barrel.
⚠ What to Watch
- • The board has proposed a confirmed 10.9% dividend reduction for 2026, undermining the income reliability essential for this strategy.
- • Long-term structural shift away from fossil fuels creates a fundamental strategy mismatch and execution risk for conservative dividend investors.
- • Current valuation at a P/E of 12.87 during a period of cyclical peak earnings offers a poor margin of safety, as energy stocks are typically best bought during commodity crashes.
📊 Historical Trends (10 Years)
Powered by EODHDThese charts show how key metrics have evolved over the past decade, helping you identify if the company is improving or deteriorating.
Debt Evolution (Net Debt / EBITDA)
Lower values are better. A declining trend indicates the company is reducing its debt (deleveraging).
Revenue & Earnings Growth
Consistent growth in revenueRevenue
The money a company brings in from selling its products or services. It’s the top line before costs. (blue) and earningsEarnings (Profit)
What’s left after expenses. Positive earnings mean the business made a profit; negative means a loss. (green) indicates a healthy business. Look for upward trends and recoveries after temporary dips.
Dividend Sustainability (FCF vs Dividends Paid)
Free cash flowFree Cash Flow
Cash left after the company pays for running the business and maintaining it. Often used to fund dividends, pay debt, or buy back shares. (FCFFCF (Free Cash Flow)
Short for Free Cash Flow: cash left after operating needs and maintenance spending., blue) should cover dividends paidDividends Paid
Cash the company paid out to shareholders. It’s not guaranteed and can change over time. (green). If dividends consistently exceed FCFFCF (Free Cash Flow)
Short for Free Cash Flow: cash left after operating needs and maintenance spending., the dividend may be at risk.
Analysis date: 2026-04-05
Disclaimer: This information is for educational purposes only. Not financial advice.