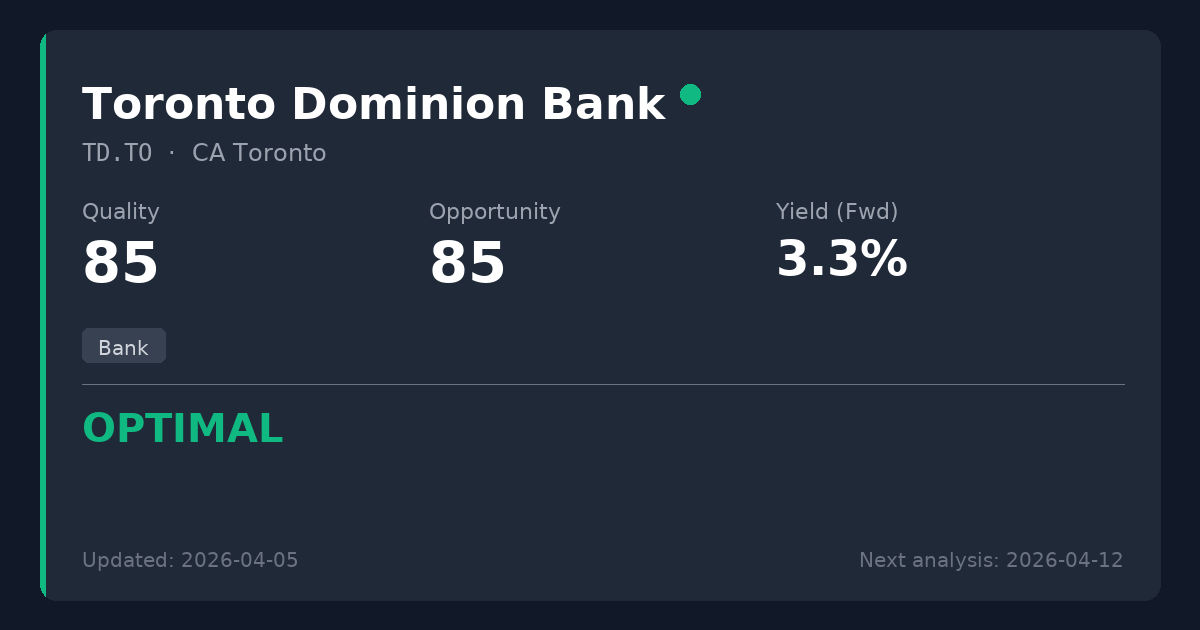
Toronto Dominion Bank
🇨🇦 TD.TO · Toronto · CA8911605092
Bank
CAD 132.51 price at analysis
Scores
Key Metrics
Powered by EODHDP/E (TTM)
10.5
P/E (Price-to-Earnings)Shows how much investors pay for each $1 of profit. We display the TTM P/E (Trailing Twelve Months) which uses actual earnings from the last 4 quarters. This is more reliable than Forward P/E which uses analyst estimates.
Calculation: 132.51 ÷ 12.66 = 10.5
TTM period through: 2026-01-31
Forward P/E (estimated): 13.9
Based on analyst estimates
Reference: Provider P/E (Trailing): 10.7
Yield (Fwd)
3.26%
Dividend YieldThe Forward yield (Fwd) shows the next announced annual dividend / current price — what you'd earn going forward. The Trailing yield (TTM) in the tooltip shows dividends actually paid in the last 12 months. Forward is shown as primary because it reflects the company's current commitment to shareholders.
Trailing Yield (TTM): 3.22%
Net Debt/EBITDA (TTM)
9.6x
Latest quarter: 47.7x
Net Debt / EBITDAA leverage ratio showing how many years of EBITDA (earnings before interest, taxes, depreciation, and amortization) it would take to repay net debt. EBITDA approximates operating cash generation. Lower ratios (e.g., <3x) are generally safer; higher (e.g., >5x) may indicate more financial risk.
TTM through: 2026-01-31
Latest quarter (2026-01-31): 47.7x
The quarterly value can spike when quarterly EBITDA is very low (e.g., one-time charges).
Quick guide: <2x manageable, >4x can be risky (sector-dependent).
Payout (Fwd)
34.1%
Payout RatioDividends as a percentage of earnings. The Forward payout (Fwd) uses the announced dividend divided by actual past earnings (TTM) — it tells you if the company can afford what it promised. Very high payouts can be risky, especially if profits fall.
Announced dividend / actual earnings (TTM)
Payout (TTM): 27.6%
Cash Flow Payout (TTM): 37.0%
FCF Coverage (TTM): 2.34x
ROE
17.8%
ROE (Return on Equity)A profitability measure: how much profit is generated from shareholders’ equity. Higher isn’t always better if it comes from high debt.
Summary
Toronto Dominion Bank is a dominant Tier-1 North American bank offering an attractive combination of a secure 3.2% yield and excellent long-term fundamentals. The recent headline net loss is a classic temporary problem driven by a one-time U.S. regulatory provision, while underlying adjusted earnings remain highly profitable at $3.6 billion. Trading at a P/E of 10.5, this represents a compelling entry point for dividend investors to acquire a high-quality financial institution that is well-positioned to weather current macroeconomic volatility.
Sector Context
Toronto Dominion Bank is a dominant Tier-1 North American bank, operating within the highly protected and profitable Canadian banking oligopoly while maintaining significant U.S. retail and commercial banking operations. For dividend investors, large Canadian banks are ideal holdings, offering exceptional stability due to stringent regulatory environments, deep competitive moats, and a long history of conservative capital management.
Temporary Opportunity Identified
A headline net loss driven by a one-time $3.57 billion provision related to U.S. anti-money laundering investigations, masking stable underlying adjusted earnings.
📊 Strategy Analysis
- • Trading at an attractive P/E of 10.47, well within the target range for high-quality banks, offering a compelling entry point.
- • The recent headline net loss is a classic temporary problem driven entirely by a one-time $3.57 billion U.S. AML provision, while core adjusted earnings remained robust at $3.6 billion.
- • Exceptional profitability metrics, including a 17.8% Return on Equity (ROE), underscoring the deep moat of its Canadian oligopoly position.
- • The 3.2% dividend yield is highly secure, supported by a conservative 50% TTM payout ratio and robust free cash flow coverage of 2.34x.
⚠ What to Watch
- • Ongoing U.S. anti-money laundering investigations and related remediation efforts may temporarily constrain U.S. expansion initiatives and elevate near-term compliance costs.
- • Macroeconomic headwinds, including high interest rates and inflation fueled by geopolitical tensions, could lead to elevated provisions for credit losses across the banking sector.
- • The Wealth Management and Insurance segment faces increased near-term claims costs driven by severe global weather events.
📊 Historical Trends (10 Years)
Powered by EODHDThese charts show how key metrics have evolved over the past decade, helping you identify if the company is improving or deteriorating.
Debt Evolution (Net Debt / EBITDA)
Lower values are better. A declining trend indicates the company is reducing its debt (deleveraging).
Revenue & Earnings Growth
Consistent growth in revenueRevenue
The money a company brings in from selling its products or services. It’s the top line before costs. (blue) and earningsEarnings (Profit)
What’s left after expenses. Positive earnings mean the business made a profit; negative means a loss. (green) indicates a healthy business. Look for upward trends and recoveries after temporary dips.
Dividend Sustainability (FCF vs Dividends Paid)
Free cash flowFree Cash Flow
Cash left after the company pays for running the business and maintaining it. Often used to fund dividends, pay debt, or buy back shares. (FCFFCF (Free Cash Flow)
Short for Free Cash Flow: cash left after operating needs and maintenance spending., blue) should cover dividends paidDividends Paid
Cash the company paid out to shareholders. It’s not guaranteed and can change over time. (green). If dividends consistently exceed FCFFCF (Free Cash Flow)
Short for Free Cash Flow: cash left after operating needs and maintenance spending., the dividend may be at risk.
Analysis date: 2026-04-05
Disclaimer: This information is for educational purposes only. Not financial advice.