3 months Premium FREE
No credit card. No commitment.
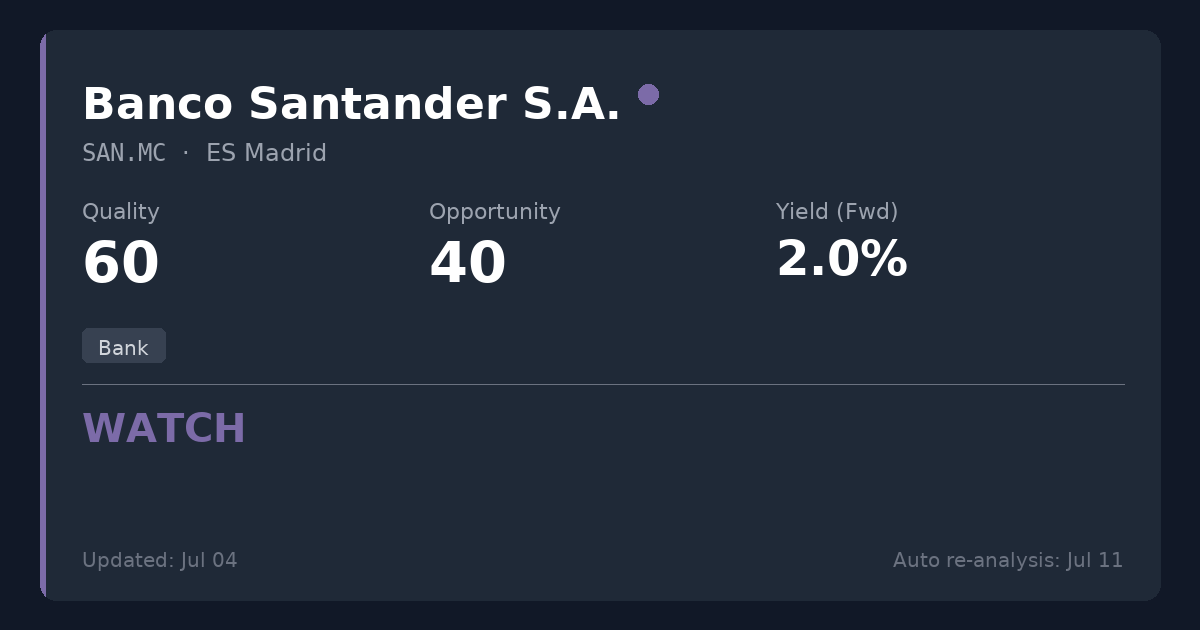
Banco Santander S.A.
🇪🇸 SAN.MC · Madrid · ES0113900J37
Bank
EUR 12.37 price at analysis
Scores
Key Metrics
Powered by EODHDP/E (TTM)
13.0
P/E (Price-to-Earnings)Shows how much investors pay for each $1 of profit. We display the TTM P/E (Trailing Twelve Months) which uses actual earnings from the last 4 quarters. This is more reliable than Forward P/E which uses analyst estimates.
Calculation: 12.37 ÷ 0.95 = 13.0
TTM period through: 2026-03-31
Forward P/E (estimated): 12.1
Based on analyst estimates
Reference: Provider P/E (Trailing): 14.0
Net Debt/EBITDA (TTM)
15.3x
Latest quarter: 50.6x
Net Debt / EBITDAA leverage ratio showing how many years of EBITDA (earnings before interest, taxes, depreciation, and amortization) it would take to repay net debt. EBITDA approximates operating cash generation. Lower ratios (e.g., <3x) are generally safer; higher (e.g., >5x) may indicate more financial risk.
TTM through: 2026-03-31
Latest quarter (2026-03-31): 50.6x
The quarterly value can spike when quarterly EBITDA is very low (e.g., one-time charges).
Quick guide: <2x manageable, >4x can be risky (sector-dependent).
ROE
12.9%
ROE (Return on Equity)A profitability measure: how much profit is generated from shareholders’ equity. Higher isn’t always better if it comes from high debt.
Dividend Summary
Powered by EODHDDividend Yield (Fwd)
2.02%
TTM: 1.98%
Dividend YieldThe Forward yield (Fwd) shows the next announced annual dividend / current price — what you'd earn going forward. The Trailing yield (TTM) in the tooltip shows dividends actually paid in the last 12 months. Forward is shown as primary because it reflects the company's current commitment to shareholders.
Forward Yield (estimated): 2.02%
Trailing Yield (TTM, last 12 months): 1.98%
Payout Ratio (Fwd)
26.4%
TTM: 23.7%
Payout RatioDividends as a percentage of earnings. The Forward payout (Fwd) uses the announced dividend divided by actual past earnings (TTM) — it tells you if the company can afford what it promised. Very high payouts can be risky, especially if profits fall.
Announced dividend / actual earnings (TTM)
Payout (Fwd): 26.4%
Payout (TTM): 23.7%
Cash Flow Payout (TTM): 4.0%
FCF Coverage (TTM): 23.25x
Growth Streak
4 yrs
Consec. increases
Div. Growth (5Y)
0.4%
Dividend History
EODHD Dividends API| Status | Type | Decl. Date | Ex-Div Date | Pay Date | Currency | Amount |
|---|---|---|---|---|---|---|
| Forecast* | Final | — | 30 Apr 2027 | — | EUR | 0.125 |
| Forecast* | Interim | — | 30 Oct 2026 | — | EUR | 0.115 |
| Paid | Final | 25 Feb 2026 | 30 Apr 2026 | 05 May 2026 | EUR | 0.125 |
| Paid | Interim | 30 Sep 2025 | 30 Oct 2025 | 03 Nov 2025 | EUR | 0.115 |
* Extrapolated from past dividend history. Not an official announcement — treat as an estimate, not a confirmed date or amount.
Summary
Banco Santander is a well-capitalized, globally diversified bank demonstrating solid profitability and robust capital returns, primarily driven by massive share buybacks rather than pure cash dividends. With the stock trading near recent highs and offering a dividend yield of just 1.98%, current valuation offers limited upside and fails to meet strict income thresholds. Existing shareholders should maintain positions given the strong underlying fundamentals and active buyback support, but new investors may want to wait for a more attractive entry point with a higher yield.
Sector Context
Banco Santander is a globally diversified commercial and retail banking group, generating revenue through traditional lending, wealth management, and corporate finance across Europe and the Americas. In the banking sector, traditional debt metrics like Debt/EBITDA do not apply as taking deposits (liabilities) is the core business model; instead, dividend investors should focus on capital adequacy, return on equity, and strict cost controls.
📊 Strategy Analysis
- • Solid profitability metrics with a Return on Equity (ROE) of 12.89%, exceeding the 10% benchmark for high-quality banking institutions.
- • Strong dividend safety with a conservative payout ratio of 26.4% and reliable cash flow coverage, alongside four consecutive years of dividend increases following a prudent 2021 regulatory reset.
- • Aggressive capital return policy via a massive €5 billion share buyback program (currently over 70% complete), which continues to heavily support the stock price.
- • Long-term revenue growth remains robust, boasting a 10.1% 10-year CAGR, driven by its highly diversified footprint across Europe and the Americas.
⚠ What to Watch
- • Current TTM dividend yield of 1.98% falls strictly below the strategy's 3% minimum threshold, making it suboptimal for pure income generation.
- • Valuation multiples appear stretched relative to European banking norms, with the stock trading near recent highs at a Price-to-Book (P/B) ratio of 1.71x, limiting the margin of safety for new capital.
- • Significant structural regulatory and litigation headwinds persist, including the extended Spanish banking tax (up to 7% on net interest/commissions) and £461 million provisioned for UK motor finance redress liabilities.
📊 Historical Trends (10 Years)
Powered by EODHDThese charts show how key metrics have evolved over the past decade, helping you identify if the company is improving or deteriorating.
Debt Evolution (Net Debt / EBITDA)
Lower values are better. A declining trend indicates the company is reducing its debt (deleveraging).
Revenue & Earnings Growth
Consistent growth in revenueRevenue
The money a company brings in from selling its products or services. It’s the top line before costs. (blue) and earningsEarnings (Profit)
What’s left after expenses. Positive earnings mean the business made a profit; negative means a loss. (green) indicates a healthy business. Look for upward trends and recoveries after temporary dips.
Dividend Sustainability (FCF vs Dividends Paid)
Free cash flowFree Cash Flow
Cash left after the company pays for running the business and maintaining it. Often used to fund dividends, pay debt, or buy back shares. (FCFFCF (Free Cash Flow)
Short for Free Cash Flow: cash left after operating needs and maintenance spending., blue) should cover dividends paidDividends Paid
Cash the company paid out to shareholders. It’s not guaranteed and can change over time. (green). If dividends consistently exceed FCFFCF (Free Cash Flow)
Short for Free Cash Flow: cash left after operating needs and maintenance spending., the dividend may be at risk.
Analysis date: 2026-07-04
Disclaimer: This information is for educational purposes only. Not financial advice.