3 months Premium FREE
No credit card. No commitment.
Main Street Capital Corporation
🇺🇸 MAIN · NYSE/NASDAQ
Bank
Price at analysis: USD 54.05 Current price: USD 53.88 * updated every night
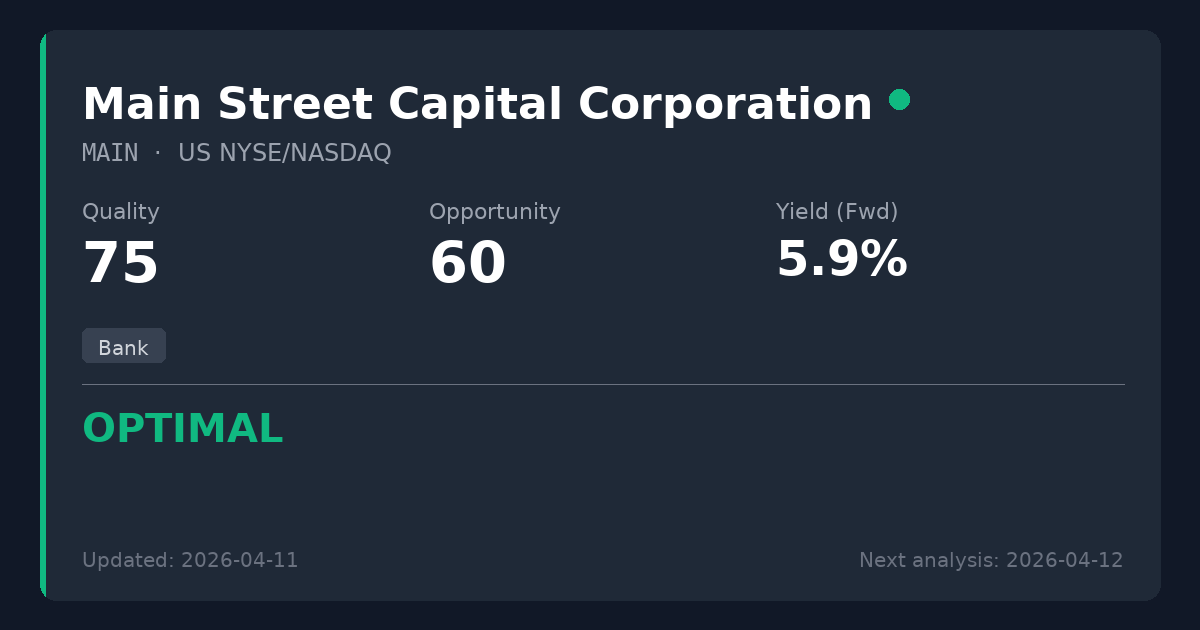
Scores
Key Metrics
Powered by EODHDP/E (TTM)
10.8
P/E (Price-to-Earnings)Shows how much investors pay for each $1 of profit. We display the TTM P/E (Trailing Twelve Months) which uses actual earnings from the last 4 quarters. This is more reliable than Forward P/E which uses analyst estimates.
Calculation: 54.05 ÷ 4.99 = 10.8
TTM period through: 2026-06-30
Forward P/E (estimated): 13.4
Based on analyst estimates
Reference: Provider P/E (Trailing): 10.9
Net Debt/EBITDA (TTM)
5.4x
Latest quarter: 26.0x
Net Debt / EBITDAA leverage ratio showing how many years of EBITDA (earnings before interest, taxes, depreciation, and amortization) it would take to repay net debt. EBITDA approximates operating cash generation. Lower ratios (e.g., <3x) are generally safer; higher (e.g., >5x) may indicate more financial risk.
TTM through: 2026-06-30
Latest quarter (2026-06-30): 26.0x
The quarterly value can spike when quarterly EBITDA is very low (e.g., one-time charges).
Quick guide: <2x manageable, >4x can be risky (sector-dependent).
ROE
14.9%
ROE (Return on Equity)A profitability measure: how much profit is generated from shareholders’ equity. Higher isn’t always better if it comes from high debt.
EV/EBITDA
15.5x
EV/EBITDAA valuation ratio that compares total business value (including debt) to EBITDA. Lower can mean cheaper, but context matters.
Dividend Summary
Powered by EODHDDividend Yield (Fwd)
5.76%
TTM: 5.78%
Dividend YieldThe Forward yield (Fwd) shows the next announced annual dividend / current price — what you'd earn going forward. The Trailing yield (TTM) in the tooltip shows dividends actually paid in the last 12 months. Forward is shown as primary because it reflects the company's current commitment to shareholders.
Forward Yield (estimated): 5.76%
Trailing Yield (TTM, last 12 months): 5.78%
Payout Ratio (Fwd)
63.7%
TTM: 77.3%
Payout RatioDividends as a percentage of earnings. The Forward payout (Fwd) uses the announced dividend divided by actual past earnings (TTM) — it tells you if the company can afford what it promised. Very high payouts can be risky, especially if profits fall.
Announced dividend / actual earnings (TTM)
Payout (Fwd): 63.7%
Payout (TTM): 77.3%
Growth Streak
5 yrs
Consec. increases
Div. Growth (5Y)
13.4%
Dividend History
EODHD Dividends API| Status | Type | Decl. Date | Ex-Div Date | Pay Date | Currency | Amount |
|---|---|---|---|---|---|---|
| Forecast* | Monthly² | — | 08 Oct 2027 | — | USD | 0.265 |
| Forecast* | Monthly² | — | 07 Aug 2027 | — | USD | 0.265 |
| Forecast* | Monthly² | — | 22 Jun 2027 | — | USD | 0.3 |
| Forecast* | Monthly² | — | 08 Apr 2027 | — | USD | 0.26 |
| Forecast* | Monthly² | — | 06 Feb 2027 | — | USD | 0.26 |
| Declared | Monthly² | 03 Aug 2026 | 08 Dec 2026 | 15 Dec 2026 | USD | 0.265 |
| Declared | Monthly² | 03 Aug 2026 | 06 Nov 2026 | 13 Nov 2026 | USD | 0.265 |
| Paid | Monthly² | 03 Aug 2026 | 08 Oct 2026 | 15 Oct 2026 | USD | 0.265 |
| Paid | Monthly² | 03 Aug 2026 | 21 Sep 2026 | 28 Sep 2026 | USD | 0.3 |
| Paid | Monthly² | 04 May 2026 | 08 Sep 2026 | 15 Sep 2026 | USD | 0.265 |
| Paid | Monthly² | 04 May 2026 | 07 Aug 2026 | 14 Aug 2026 | USD | 0.265 |
| Paid | Monthly² | 04 May 2026 | 08 Jul 2026 | 15 Jul 2026 | USD | 0.265 |
| Paid | Monthly² | 04 May 2026 | 22 Jun 2026 | 29 Jun 2026 | USD | 0.3 |
| Paid | Monthly² | 24 Feb 2026 | 08 Jun 2026 | 15 Jun 2026 | USD | 0.26 |
| Paid | Monthly² | 24 Feb 2026 | 08 May 2026 | 15 May 2026 | USD | 0.26 |
| Paid | Monthly² | 24 Feb 2026 | 08 Apr 2026 | 15 Apr 2026 | USD | 0.26 |
| Paid | Monthly² | 23 Feb 2026 | 20 Mar 2026 | 27 Mar 2026 | USD | 0.3 |
| Paid | Monthly² | 03 Nov 2025 | 06 Mar 2026 | 13 Mar 2026 | USD | 0.26 |
| Paid | Monthly² | 03 Nov 2025 | 06 Feb 2026 | 13 Feb 2026 | USD | 0.26 |
| Paid | Monthly² | 03 Nov 2025 | 08 Jan 2026 | 15 Jan 2026 | USD | 0.26 |
| Paid | Monthly² | 03 Nov 2025 | 22 Dec 2025 | 29 Dec 2025 | USD | 0.3 |
| Paid | Monthly² | 04 Aug 2025 | 08 Dec 2025 | 15 Dec 2025 | USD | 0.255 |
| Paid | Monthly² | 04 Aug 2025 | 07 Nov 2025 | 14 Nov 2025 | USD | 0.255 |
* Extrapolated from past dividend history. Not an official announcement — treat as an estimate, not a confirmed date or amount.
² Type not provided by EODHD — inferred from historical payment data.
Summary
Main Street Capital remains a premier, internally managed BDC offering a structural cost advantage and an exceptional track record of reliable monthly distributions. The company recently raised its regular dividend and continues to post consecutive quarters of NAV growth, mitigating concerns over short-term revenue fluctuations. Worth considering for new positions, though the steep premium to NAV warrants a phased entry approach to manage valuation risk.
Sector Context
Main Street Capital operates as a Business Development Company (BDC) within the Asset Management/Financial sector. By utilizing an internally managed structure, it avoids the hefty external management fees typical of the industry, translating directly into higher net investment income and safer, more sustainable distributions for dividend growth investors.
📊 Strategy Analysis
- • Internally managed structure provides a durable structural cost advantage over externally managed peers, supporting a strong 14.92% ROE.
- • Consistent track record of dividend growth, recently increasing its regular monthly distribution by 3.9% alongside a $0.30 supplemental dividend.
- • Preliminary Q3 2026 estimates indicate NAV rising to $34.18–$34.26 per share, maintaining a multi-year streak of NAV growth.
- • Attractive valuation based on a P/E (TTM) of 10.83x paired with a robust forward dividend yield of 6.53%.
⚠ What to Watch
- • Shares trade at a steep 57% premium to Net Asset Value (NAV of $34.43), which substantially reduces the margin of safety for new capital deployment.
- • The trailing 8-quarter trajectory shows declining revenue and earnings, which warrants close monitoring as the broader interest rate environment shifts.
- • Structurally constrained by the Subchapter M (RIC) tax mandate requiring the distribution of at least 90% of taxable income, perpetually forcing reliance on capital markets for portfolio growth.
📊 Historical Trends (10 Years)
Powered by EODHDThese charts show how key metrics have evolved over the past decade, helping you identify if the company is improving or deteriorating.
Debt Evolution (Net Debt / EBITDA)
Lower values are better. A declining trend indicates the company is reducing its debt (deleveraging).
Revenue & Earnings Growth
Consistent growth in revenueRevenue
The money a company brings in from selling its products or services. It’s the top line before costs. (blue) and earningsEarnings (Profit)
What’s left after expenses. Positive earnings mean the business made a profit; negative means a loss. (green) indicates a healthy business. Look for upward trends and recoveries after temporary dips.
Analysis date: 2026-10-17
Disclaimer: This information is for educational purposes only. Not financial advice.