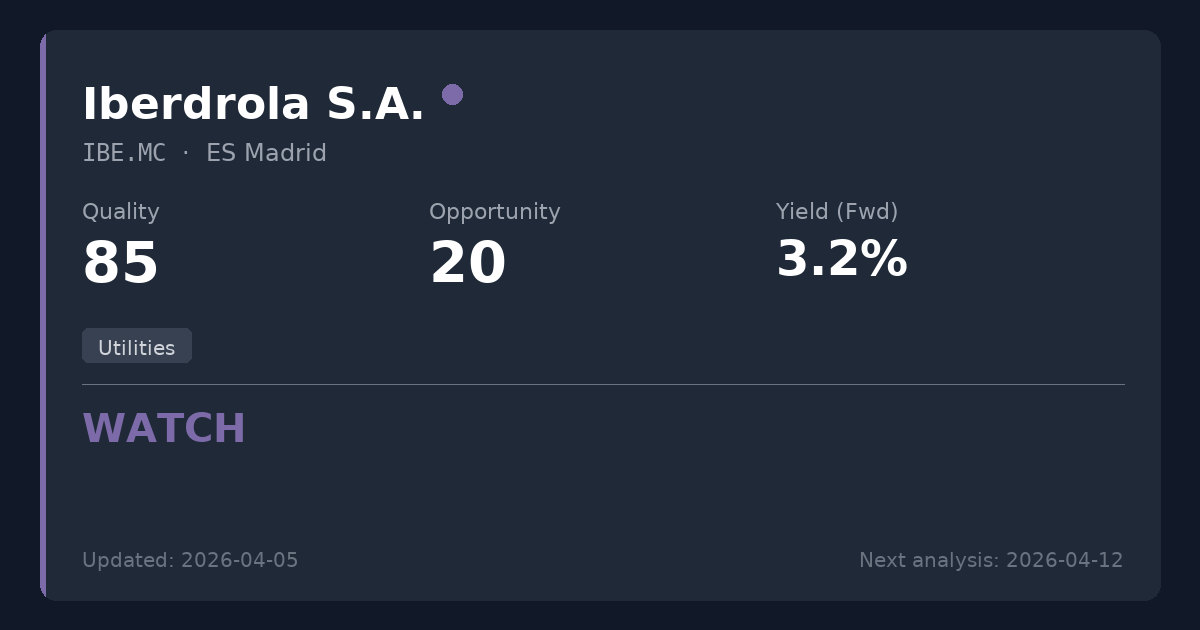
Iberdrola S.A.
🇪🇸 IBE.MC · Madrid · ES0144580Y14
Utilities
EUR 20.36 price at analysis
Scores
Key Metrics
Powered by EODHDP/E (TTM)
21.6
P/E (Price-to-Earnings)Shows how much investors pay for each $1 of profit. We display the TTM P/E (Trailing Twelve Months) which uses actual earnings from the last 4 quarters. This is more reliable than Forward P/E which uses analyst estimates.
Calculation: 20.36 ÷ 0.94 = 21.6
TTM period through: 2025-12-31
Forward P/E (estimated): 20.5
Based on analyst estimates
Reference: Provider P/E (Trailing): 24.2
Yield (Fwd)
3.24%
Dividend YieldThe Forward yield (Fwd) shows the next announced annual dividend / current price — what you'd earn going forward. The Trailing yield (TTM) in the tooltip shows dividends actually paid in the last 12 months. Forward is shown as primary because it reflects the company's current commitment to shareholders.
Trailing Yield (TTM): 3.39%
Net Debt/EBITDA (TTM)
3.4x
Latest quarter: 13.5x
Net Debt / EBITDAA leverage ratio showing how many years of EBITDA (earnings before interest, taxes, depreciation, and amortization) it would take to repay net debt. EBITDA approximates operating cash generation. Lower ratios (e.g., <3x) are generally safer; higher (e.g., >5x) may indicate more financial risk.
TTM through: 2025-12-31
Latest quarter (2025-12-31): 13.5x
The quarterly value can spike when quarterly EBITDA is very low (e.g., one-time charges).
Quick guide: <2x manageable, >4x can be risky (sector-dependent).
Payout (Fwd)
70.2%
Payout RatioDividends as a percentage of earnings. The Forward payout (Fwd) uses the announced dividend divided by actual past earnings (TTM) — it tells you if the company can afford what it promised. Very high payouts can be risky, especially if profits fall.
Announced dividend / actual earnings (TTM)
Payout (TTM): 20.3%
Cash Flow Payout (TTM): 14.5%
FCF Coverage (TTM): 0.93x
ROE
10.3%
ROE (Return on Equity)A profitability measure: how much profit is generated from shareholders’ equity. Higher isn’t always better if it comes from high debt.
EV/EBITDA
11.2x
EV/EBITDAA valuation ratio that compares total business value (including debt) to EBITDA. Lower can mean cheaper, but context matters.
Summary
Iberdrola is a premier global utility and renewable energy leader offering defensive cash flows and essential infrastructure services. While the company boasts an excellent economic moat and a reliable 3.39% yield, the current valuation around €20.36 (P/E 21.6) offers limited upside. Existing shareholders should maintain positions given the fundamental quality, but new investors may want to wait for a better entry point closer to historical valuation averages.
Sector Context
Iberdrola generates, distributes, and supplies electricity, operating as one of the world's largest producers of renewable energy. For dividend investors, regulated utilities offer highly defensive, predictable cash flows, though they typically operate with higher debt levels (such as Iberdrola's 3.38x Net Debt/EBITDA) to fund capital-intensive infrastructure and grid projects.
📊 Strategy Analysis
- • Leading global utility with a strong competitive moat and predictable cash flows supported by regulated electricity networks and long-term renewable power purchase agreements.
- • Robust profitability metrics, including an expanding net margin of 13.8% and a strong EBITDA margin of 36.4%.
- • Provides an attractive 3.39% dividend yield backed by consistent long-term EPS growth (9.3% 5-year CAGR) and stable debt metrics typical for the utility sector.
⚠ What to Watch
- • Current valuation at a P/E of 21.64 is significantly elevated compared to the preferred 8-15x range for conservative dividend strategies.
- • Current price of €20.36 trades above our calculated monopoly fair value upper bound of €18.81, limiting upside potential.
- • Heavy capital expenditure requirements for global grid upgrades and the renewable transition are currently constraining free cash flow dividend coverage (0.93x).
📊 Historical Trends (10 Years)
Powered by EODHDThese charts show how key metrics have evolved over the past decade, helping you identify if the company is improving or deteriorating.
Debt Evolution (Net Debt / EBITDA)
Lower values are better. A declining trend indicates the company is reducing its debt (deleveraging).
Revenue & Earnings Growth
Consistent growth in revenueRevenue
The money a company brings in from selling its products or services. It’s the top line before costs. (blue) and earningsEarnings (Profit)
What’s left after expenses. Positive earnings mean the business made a profit; negative means a loss. (green) indicates a healthy business. Look for upward trends and recoveries after temporary dips.
Dividend Sustainability (FCF vs Dividends Paid)
Free cash flowFree Cash Flow
Cash left after the company pays for running the business and maintaining it. Often used to fund dividends, pay debt, or buy back shares. (FCFFCF (Free Cash Flow)
Short for Free Cash Flow: cash left after operating needs and maintenance spending., blue) should cover dividends paidDividends Paid
Cash the company paid out to shareholders. It’s not guaranteed and can change over time. (green). If dividends consistently exceed FCFFCF (Free Cash Flow)
Short for Free Cash Flow: cash left after operating needs and maintenance spending., the dividend may be at risk.
Analysis date: 2026-04-04
Disclaimer: This information is for educational purposes only. Not financial advice.