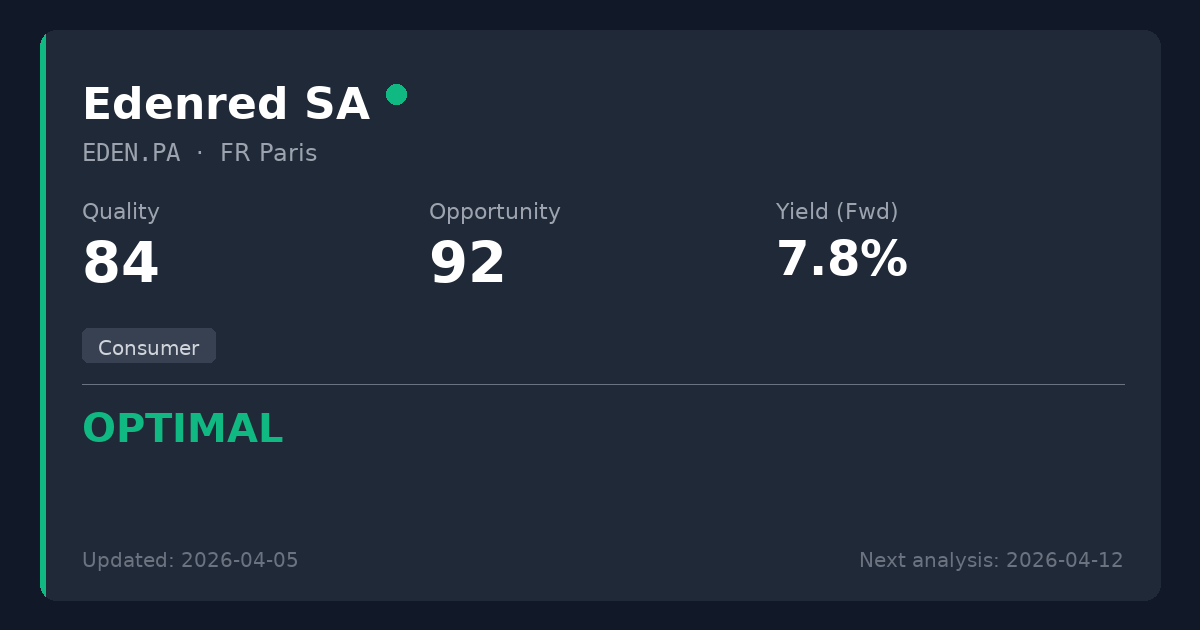
Edenred SA
🇫🇷 EDEN.PA · Paris · FR0010908533
Consumer
EUR 17.12 price at analysis
Scores
Key Metrics
Powered by EODHDP/E (TTM)
7.8
P/E (Price-to-Earnings)Shows how much investors pay for each $1 of profit. We display the TTM P/E (Trailing Twelve Months) which uses actual earnings from the last 4 quarters. This is more reliable than Forward P/E which uses analyst estimates.
Calculation: 17.12 ÷ 2.18 = 7.8
TTM period through: 2025-12-31
Forward P/E (estimated): 7.7
Based on analyst estimates
Reference: Provider P/E (Trailing): 8.1
Yield (Fwd)
7.77%
Dividend YieldThe Forward yield (Fwd) shows the next announced annual dividend / current price — what you'd earn going forward. The Trailing yield (TTM) in the tooltip shows dividends actually paid in the last 12 months. Forward is shown as primary because it reflects the company's current commitment to shareholders.
Trailing Yield (TTM): 7.79%
Net Debt/EBITDA (TTM)
-0.4x
Latest quarter: -0.7x
Net Debt / EBITDAA leverage ratio showing how many years of EBITDA (earnings before interest, taxes, depreciation, and amortization) it would take to repay net debt. EBITDA approximates operating cash generation. Lower ratios (e.g., <3x) are generally safer; higher (e.g., >5x) may indicate more financial risk.
TTM through: 2025-12-31
Latest quarter (2025-12-31): -0.7x
The quarterly value can spike when quarterly EBITDA is very low (e.g., one-time charges).
Quick guide: <2x manageable, >4x can be risky (sector-dependent).
Payout (Fwd)
60.9%
Payout RatioDividends as a percentage of earnings. The Forward payout (Fwd) uses the announced dividend divided by actual past earnings (TTM) — it tells you if the company can afford what it promised. Very high payouts can be risky, especially if profits fall.
Announced dividend / actual earnings (TTM)
Payout (TTM): 55.5%
Cash Flow Payout (TTM): 26.3%
FCF Coverage (TTM): 3.12x
EV/EBITDA
4.0x
EV/EBITDAA valuation ratio that compares total business value (including debt) to EBITDA. Lower can mean cheaper, but context matters.
Summary
Edenred is a high-quality global leader in employee benefits and corporate payment solutions, generating exceptionally resilient, cash-rich recurring revenues. The recent Italian antitrust probe has triggered a severe market overreaction, creating a textbook temporary problem that pushed the yield to a highly secure 7.8%. Trading at €17.12, well below our fair value estimate of €28-35 (representing 63-104% upside), this is an exceptionally attractive entry point. Worth considering for new positions at current levels, offering both massive income and capital appreciation potential while waiting for regulatory noise to fade.
Sector Context
Edenred operates a global B2B digital platform, primarily known for employee benefits (like Ticket Restaurant) and fleet mobility solutions. These services benefit from strong network effects and act as essential, tax-advantaged corporate retention tools. For dividend investors, this sector is highly attractive because revenue is recurring, requires very little capital expenditure (high free cash flow), and naturally benefits from inflation as voucher values increase alongside food and fuel prices.
Temporary Opportunity Identified
Severe market panic and selloff driven by an Italian antitrust probe (AGCM) regarding alleged abuse of dominant position in the meal voucher market, compounding earlier fears over Brazilian regulations.
📊 Strategy Analysis
- • Trading at a highly compressed P/E of 7.8x, well below fair value range of €28-35, representing a rare discount for a company with a 5-year EPS CAGR of 12.9%.
- • The 7.8% dividend yield is exceptionally safe, supported by a 57% earnings payout ratio and a highly conservative 26.3% Free Cash Flow payout ratio.
- • Pristine balance sheet with a net cash position (Net Debt/EBITDA of -0.37x) provides immense financial flexibility to weather any regulatory fines or macroeconomic shocks.
- • Powerful network effects (employers, employees, and merchants) create a resilient competitive moat that naturally hedges against inflation as meal prices rise.
⚠ What to Watch
- • The ongoing Italian antitrust investigation (AGCM) regarding alleged abuse of dominant position introduces significant near-term headline risk and potential localized margin pressure.
- • The business model is sensitive to tax and labor regulations across various global jurisdictions, as evidenced by recent volatility related to Brazilian and Italian markets.
- • While well-covered now, historical dividend cuts during the COVID crisis (2019/2020) demonstrate management's willingness to reduce payouts during severe systemic disruptions.
📊 Historical Trends (10 Years)
Powered by EODHDThese charts show how key metrics have evolved over the past decade, helping you identify if the company is improving or deteriorating.
Debt Evolution (Net Debt / EBITDA)
Lower values are better. A declining trend indicates the company is reducing its debt (deleveraging).
Revenue & Earnings Growth
Consistent growth in revenueRevenue
The money a company brings in from selling its products or services. It’s the top line before costs. (blue) and earningsEarnings (Profit)
What’s left after expenses. Positive earnings mean the business made a profit; negative means a loss. (green) indicates a healthy business. Look for upward trends and recoveries after temporary dips.
Dividend Sustainability (FCF vs Dividends Paid)
Free cash flowFree Cash Flow
Cash left after the company pays for running the business and maintaining it. Often used to fund dividends, pay debt, or buy back shares. (FCFFCF (Free Cash Flow)
Short for Free Cash Flow: cash left after operating needs and maintenance spending., blue) should cover dividends paidDividends Paid
Cash the company paid out to shareholders. It’s not guaranteed and can change over time. (green). If dividends consistently exceed FCFFCF (Free Cash Flow)
Short for Free Cash Flow: cash left after operating needs and maintenance spending., the dividend may be at risk.
Analysis date: 2026-04-04
Disclaimer: This information is for educational purposes only. Not financial advice.