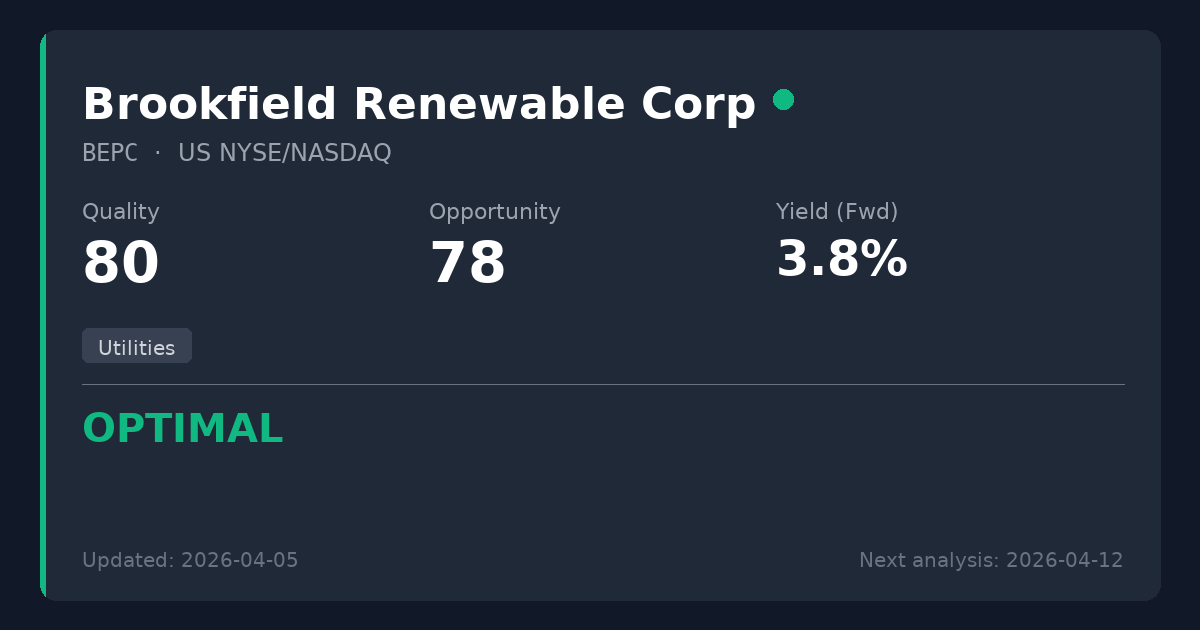
Brookfield Renewable Corp
🇺🇸 BEPC · NYSE/NASDAQ · CA11284V1058
Utilities
USD 41.32 price at analysis
Scores
Key Metrics
Powered by EODHDP/E (TTM)
N/A
P/E (Price-to-Earnings)Shows how much investors pay for each $1 of profit. We display the TTM P/E (Trailing Twelve Months) which uses actual earnings from the last 4 quarters. This is more reliable than Forward P/E which uses analyst estimates.
TTM period through: 2025-12-31
Why N/A?
EPS (TTM) = -13.05 (negative or zero)
Cannot calculate P/E with negative earnings.
Forward P/E (estimated): 14.6
Based on analyst estimates
Reference: Provider P/E (Forward): 14.6
Yield (Fwd)
3.80%
Dividend YieldThe Forward yield (Fwd) shows the next announced annual dividend / current price — what you'd earn going forward. The Trailing yield (TTM) in the tooltip shows dividends actually paid in the last 12 months. Forward is shown as primary because it reflects the company's current commitment to shareholders.
Trailing Yield (TTM): 3.79%
Net Debt/EBITDA (TTM)
36.6x
Latest quarter: 333.9x
Net Debt / EBITDAA leverage ratio showing how many years of EBITDA (earnings before interest, taxes, depreciation, and amortization) it would take to repay net debt. EBITDA approximates operating cash generation. Lower ratios (e.g., <3x) are generally safer; higher (e.g., >5x) may indicate more financial risk.
TTM through: 2025-12-31
Latest quarter (2025-12-31): 333.9x
The quarterly value can spike when quarterly EBITDA is very low (e.g., one-time charges).
Quick guide: <2x manageable, >4x can be risky (sector-dependent).
Payout (TTM)
108.1%
Payout RatioDividends as a percentage of earnings. The Forward payout (Fwd) uses the announced dividend divided by actual past earnings (TTM) — it tells you if the company can afford what it promised. Very high payouts can be risky, especially if profits fall.
Cash Flow Payout (TTM): 1.0%
FCF Coverage (TTM): -126.60x
ROE
-22.0%
ROE (Return on Equity)A profitability measure: how much profit is generated from shareholders’ equity. Higher isn’t always better if it comes from high debt.
EV/EBITDA
39.9x
EV/EBITDAA valuation ratio that compares total business value (including debt) to EBITDA. Lower can mean cheaper, but context matters.
Summary
Brookfield Renewable Corp is a premier global renewable utility offering essential energy infrastructure backed by strong, contracted cash flows. The recent headline GAAP net losses are temporary accounting anomalies related to non-cash share remeasurements, masking robust underlying operational performance and FFO growth. Trading at an attractive forward P/E of 14.6 with a 3.8% yield, the stock is worth considering for new positions, offering a compelling entry point for long-term dividend investors seeking quality infrastructure exposure.
Sector Context
Brookfield Renewable Corp is a global owner and operator of renewable power assets, including hydroelectric, wind, solar, and storage facilities, generating stable revenue through long-term power purchase agreements. In the utility and renewable infrastructure sector, investors must typically look past GAAP net income—which can be heavily skewed by non-cash depreciation and complex structural accounting—and instead focus on Funds From Operations (FFO) to assess true dividend sustainability and operating health.
Temporary Opportunity Identified
Significant headline GAAP net losses are purely the result of non-cash accounting adjustments stemming from the remeasurement of BEPC exchangeable shares, which masks the company's strong underlying FFO growth.
📊 Strategy Analysis
- • Underlying operational performance remains robust, evidenced by a 9% year-over-year increase in Funds From Operations (FFO) despite headline accounting losses.
- • Trading at an attractive forward P/E of 14.6, placing it well within the valuation sweet spot while offering a reliable 3.8% dividend yield.
- • Operates as a premier pure-play renewable utility, providing essential energy infrastructure supported by highly contracted, inflation-linked long-term cash flows.
⚠ What to Watch
- • The optically extreme Net Debt/EBITDA of 36.6x and negative reported free cash flow metrics require monitoring, even when factoring in the typical use of non-recourse project-level debt.
- • Persistent GAAP net losses driven by complex non-cash share remeasurements can distort traditional fundamental screens and create headline price volatility during market stress.
📊 Historical Trends (10 Years)
Powered by EODHDThese charts show how key metrics have evolved over the past decade, helping you identify if the company is improving or deteriorating.
Debt Evolution (Net Debt / EBITDA)
Lower values are better. A declining trend indicates the company is reducing its debt (deleveraging).
Revenue & Earnings Growth
Consistent growth in revenueRevenue
The money a company brings in from selling its products or services. It’s the top line before costs. (blue) and earningsEarnings (Profit)
What’s left after expenses. Positive earnings mean the business made a profit; negative means a loss. (green) indicates a healthy business. Look for upward trends and recoveries after temporary dips.
Dividend Sustainability (FCF vs Dividends Paid)
Free cash flowFree Cash Flow
Cash left after the company pays for running the business and maintaining it. Often used to fund dividends, pay debt, or buy back shares. (FCFFCF (Free Cash Flow)
Short for Free Cash Flow: cash left after operating needs and maintenance spending., blue) should cover dividends paidDividends Paid
Cash the company paid out to shareholders. It’s not guaranteed and can change over time. (green). If dividends consistently exceed FCFFCF (Free Cash Flow)
Short for Free Cash Flow: cash left after operating needs and maintenance spending., the dividend may be at risk.
Analysis date: 2026-04-04
Disclaimer: This information is for educational purposes only. Not financial advice.