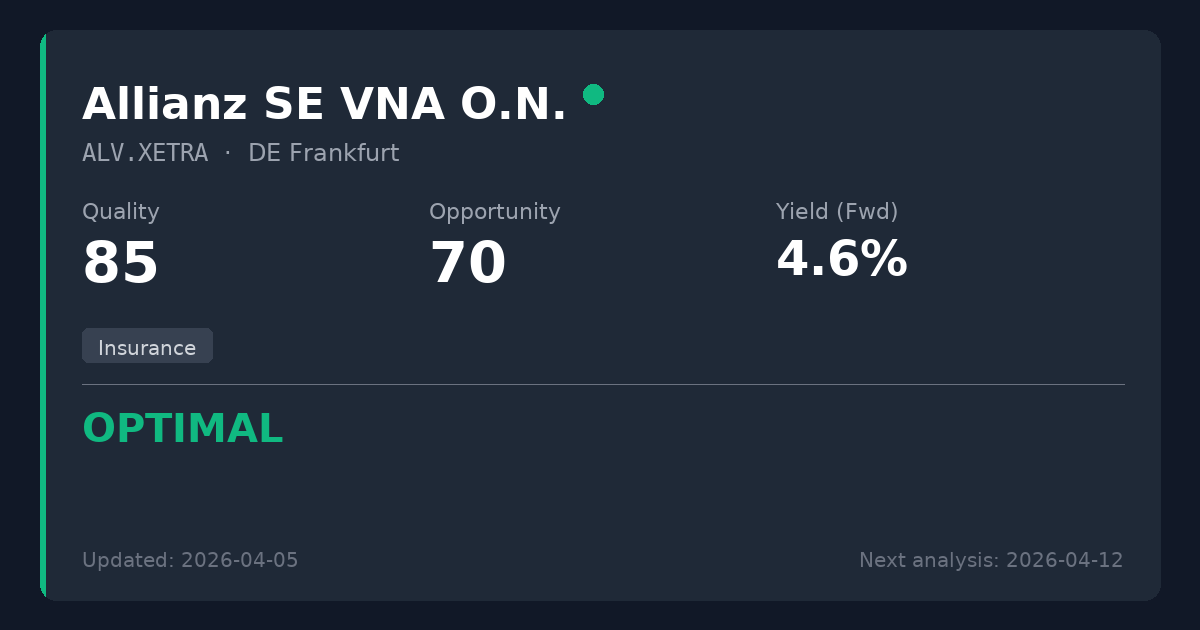
Allianz SE VNA O.N.
🇩🇪 ALV.XETRA · Frankfurt · DE0008404005
Insurance
EUR 367.90 price at analysis
Scores
Key Metrics
Powered by EODHDP/E (TTM)
12.9
P/E (Price-to-Earnings)Shows how much investors pay for each $1 of profit. We display the TTM P/E (Trailing Twelve Months) which uses actual earnings from the last 4 quarters. This is more reliable than Forward P/E which uses analyst estimates.
Calculation: 367.90 ÷ 28.61 = 12.9
TTM period through: 2025-12-31
Forward P/E (estimated): 12.0
Based on analyst estimates
Reference: Provider P/E (Trailing): 13.3
Yield (Fwd)
4.65%
Dividend YieldThe Forward yield (Fwd) shows the next announced annual dividend / current price — what you'd earn going forward. The Trailing yield (TTM) in the tooltip shows dividends actually paid in the last 12 months. Forward is shown as primary because it reflects the company's current commitment to shareholders.
Trailing Yield (TTM): 4.65%
Net Debt/EBITDA (TTM)
-0.1x
Latest quarter: -0.3x
Net Debt / EBITDAA leverage ratio showing how many years of EBITDA (earnings before interest, taxes, depreciation, and amortization) it would take to repay net debt. EBITDA approximates operating cash generation. Lower ratios (e.g., <3x) are generally safer; higher (e.g., >5x) may indicate more financial risk.
TTM through: 2025-12-31
Latest quarter (2025-12-31): -0.3x
The quarterly value can spike when quarterly EBITDA is very low (e.g., one-time charges).
Quick guide: <2x manageable, >4x can be risky (sector-dependent).
Payout (Fwd)
59.8%
Payout RatioDividends as a percentage of earnings. The Forward payout (Fwd) uses the announced dividend divided by actual past earnings (TTM) — it tells you if the company can afford what it promised. Very high payouts can be risky, especially if profits fall.
Announced dividend / actual earnings (TTM)
Payout (TTM): 59.3%
Cash Flow Payout (TTM): 19.2%
FCF Coverage (TTM): 4.93x
ROE
17.5%
ROE (Return on Equity)A profitability measure: how much profit is generated from shareholders’ equity. Higher isn’t always better if it comes from high debt.
Summary
Allianz is a dominant global insurance and asset management leader with an exceptional track record of dividend reliability, rock-solid solvency metrics, and highly profitable operations generating 17.5% ROE. Trading at an attractive P/E of 12.9 with a secure 4.65% yield, it represents a compelling entry point for dividend investors seeking quality financial exposure in the OPTIMAL quadrant. Worth considering for new positions at current levels, as the combination of massive free cash flow coverage, aggressive share buybacks, and an 11% recent dividend hike provides a substantial margin of safety.
Sector Context
Allianz is a global financial services provider primarily focused on property-casualty insurance, life/health insurance, and asset management. In the insurance sector, key metrics include Solvency II ratios and the ability to generate returns on massive investment portfolios (the 'float'). Allianz excels in this space with a massive balance sheet, utilizing its highly regulated, essential financial services to generate extremely reliable cash flows that comfortably support long-term dividend distributions.
Temporary Opportunity Identified
Broader DAX index volatility tied to macroeconomic inflation fears and geopolitical tensions, combined with mixed short-term sentiment over recent strategic AI investments, have created minor price fluctuations masking exceptional operational results.
📊 Strategy Analysis
- • Exceptional dividend sustainability with an unbroken 10-year track record of growth (7.9% CAGR), supported by a conservative 54% TTM payout ratio and massive free cash flow coverage of 4.9x.
- • Trading at an attractive P/E of 12.9, falling comfortably within the 8-15x strategy sweet spot, while offering a robust 4.65% yield.
- • Recent financial results showcase outstanding fundamental strength, including a record operating profit, an 11% dividend increase, and a new €2.5 billion share buyback program.
- • Capitalization remains exceptionally strong with a Solvency II ratio of 218% and a negative Net Debt/EBITDA of -0.07x, providing significant defensive buffers against market shocks.
⚠ What to Watch
- • Broader macroeconomic volatility and elevated geopolitical tensions could cause short-term fluctuations in the valuation of the company's massive investment portfolio.
- • Recent $350 million investments in AI telematics have sparked mixed short-term analyst reactions regarding near-term margin impacts, despite their long-term strategic value.
📊 Historical Trends (10 Years)
Powered by EODHDThese charts show how key metrics have evolved over the past decade, helping you identify if the company is improving or deteriorating.
Debt Evolution (Net Debt / EBITDA)
Lower values are better. A declining trend indicates the company is reducing its debt (deleveraging).
Revenue & Earnings Growth
Consistent growth in revenueRevenue
The money a company brings in from selling its products or services. It’s the top line before costs. (blue) and earningsEarnings (Profit)
What’s left after expenses. Positive earnings mean the business made a profit; negative means a loss. (green) indicates a healthy business. Look for upward trends and recoveries after temporary dips.
Dividend Sustainability (FCF vs Dividends Paid)
Free cash flowFree Cash Flow
Cash left after the company pays for running the business and maintaining it. Often used to fund dividends, pay debt, or buy back shares. (FCFFCF (Free Cash Flow)
Short for Free Cash Flow: cash left after operating needs and maintenance spending., blue) should cover dividends paidDividends Paid
Cash the company paid out to shareholders. It’s not guaranteed and can change over time. (green). If dividends consistently exceed FCFFCF (Free Cash Flow)
Short for Free Cash Flow: cash left after operating needs and maintenance spending., the dividend may be at risk.
Analysis date: 2026-04-04
Disclaimer: This information is for educational purposes only. Not financial advice.