3 months Premium FREE
No credit card. No commitment.
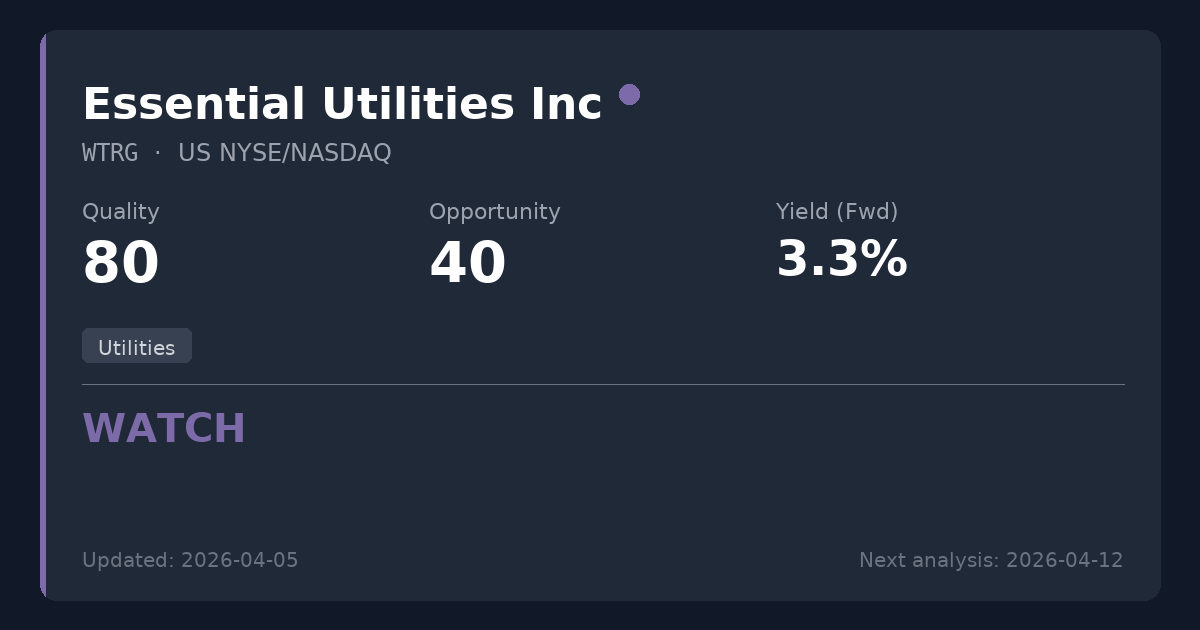
Essential Utilities Inc
🇺🇸 WTRG · NYSE/NASDAQ · US29670G1022
Utilities
USD 38.70 price at analysis
Scores
Key Metrics
Powered by EODHDP/E (TTM)
19.7
P/E (Price-to-Earnings)Shows how much investors pay for each $1 of profit. We display the TTM P/E (Trailing Twelve Months) which uses actual earnings from the last 4 quarters. This is more reliable than Forward P/E which uses analyst estimates.
Calculation: 38.70 ÷ 1.97 = 19.7
TTM period through: 2026-03-31
Forward P/E (estimated): 16.9
Based on analyst estimates
Reference: Provider P/E (Trailing): 20.1
Net Debt/EBITDA (TTM)
6.2x
Latest quarter: 19.5x
Net Debt / EBITDAA leverage ratio showing how many years of EBITDA (earnings before interest, taxes, depreciation, and amortization) it would take to repay net debt. EBITDA approximates operating cash generation. Lower ratios (e.g., <3x) are generally safer; higher (e.g., >5x) may indicate more financial risk.
TTM through: 2026-03-31
Latest quarter (2026-03-31): 19.5x
The quarterly value can spike when quarterly EBITDA is very low (e.g., one-time charges).
Quick guide: <2x manageable, >4x can be risky (sector-dependent).
ROE
8.3%
ROE (Return on Equity)A profitability measure: how much profit is generated from shareholders’ equity. Higher isn’t always better if it comes from high debt.
EV/EBITDA
14.2x
EV/EBITDAA valuation ratio that compares total business value (including debt) to EBITDA. Lower can mean cheaper, but context matters.
Dividend Summary
Powered by EODHDDividend Yield (Fwd)
3.54%
TTM: 3.56%
Dividend YieldThe Forward yield (Fwd) shows the next announced annual dividend / current price — what you'd earn going forward. The Trailing yield (TTM) in the tooltip shows dividends actually paid in the last 12 months. Forward is shown as primary because it reflects the company's current commitment to shareholders.
Forward Yield (estimated): 3.54%
Trailing Yield (TTM, last 12 months): 3.56%
Payout Ratio (Fwd)
69.6%
TTM: 68.5%
Payout RatioDividends as a percentage of earnings. The Forward payout (Fwd) uses the announced dividend divided by actual past earnings (TTM) — it tells you if the company can afford what it promised. Very high payouts can be risky, especially if profits fall.
Announced dividend / actual earnings (TTM)
Payout (Fwd): 69.6%
Payout (TTM): 68.5%
Cash Flow Payout (TTM): 39.1%
FCF Coverage (TTM): -1.33x
Growth Streak
8 yrs
Consec. increases
Div. Growth (5Y)
6.6%
Dividend History
EODHD Dividends API| Status | Type | Decl. Date | Ex-Div Date | Pay Date | Currency | Amount |
|---|---|---|---|---|---|---|
| Forecast* | Quarterly | — | 12 May 2027 | — | USD | 0.343 |
| Forecast* | Quarterly | — | 09 Feb 2027 | — | USD | 0.343 |
| Forecast* | Quarterly | — | 12 Nov 2026 | — | USD | 0.343 |
| Forecast* | Quarterly | — | 12 Aug 2026 | — | USD | 0.343 |
| Paid | Quarterly | 17 Feb 2026 | 12 May 2026 | 01 Jun 2026 | USD | 0.343 |
| Paid | Quarterly | 23 Jan 2026 | 09 Feb 2026 | 02 Mar 2026 | USD | 0.343 |
| Paid | Quarterly | 23 Oct 2025 | 12 Nov 2025 | 01 Dec 2025 | USD | 0.343 |
| Paid | Quarterly | 30 Jul 2025 | 12 Aug 2025 | 02 Sep 2025 | USD | 0.343 |
* Extrapolated from past dividend history. Not an official announcement — treat as an estimate, not a confirmed date or amount.
Summary
Essential Utilities is a premier regulated water and gas utility with an exceptional 56-year dividend history and highly predictable revenues. While the underlying business quality is excellent and the 3.56% yield remains secure, the pending all-stock merger with American Water Works effectively pegs the stock to the acquirer's share price, limiting independent upside. Existing shareholders should maintain positions to collect the reliable yield while the merger progresses, though current valuation dynamics offer limited capital appreciation potential for new investors.
Sector Context
Essential Utilities provides regulated drinking water, wastewater treatment, and natural gas distribution services across multiple U.S. states. Regulated water utilities operate as localized monopolies with guaranteed rates of return on infrastructure investments, making them highly defensive dividend payers, though they require massive ongoing capital expenditures for environmental compliance and pipeline modernization.
📊 Strategy Analysis
- • Exceptional 56-year dividend history with 33 consecutive years of increases, showcasing immense commitment to shareholder returns.
- • Operates as a regulated water and gas monopoly, providing highly predictable revenues and resilient cash flows regardless of economic cycles.
- • Trades at an attractive P/FFO of 10.55x, indicating the underlying infrastructure assets are reasonably valued and supporting the secure 3.56% yield.
⚠ What to Watch
- • The pending all-stock merger with American Water Works (0.305 exchange ratio) fundamentally pegs WTRG's share price to the acquirer, capping independent upside.
- • Elevated Net Debt/EBITDA of 6.20x and persistent negative free cash flow necessitate ongoing reliance on capital markets to fund intensive infrastructure programs.
- • Looming multi-year capital requirements are severe, specifically the $450 million mandate for EPA PFAS remediation and forced lead pipe replacements.
📊 Historical Trends (10 Years)
Powered by EODHDThese charts show how key metrics have evolved over the past decade, helping you identify if the company is improving or deteriorating.
Debt Evolution (Net Debt / EBITDA)
Lower values are better. A declining trend indicates the company is reducing its debt (deleveraging).
Revenue & Earnings Growth
Consistent growth in revenueRevenue
The money a company brings in from selling its products or services. It’s the top line before costs. (blue) and earningsEarnings (Profit)
What’s left after expenses. Positive earnings mean the business made a profit; negative means a loss. (green) indicates a healthy business. Look for upward trends and recoveries after temporary dips.
Dividend Sustainability (FCF vs Dividends Paid)
Free cash flowFree Cash Flow
Cash left after the company pays for running the business and maintaining it. Often used to fund dividends, pay debt, or buy back shares. (FCFFCF (Free Cash Flow)
Short for Free Cash Flow: cash left after operating needs and maintenance spending., blue) should cover dividends paidDividends Paid
Cash the company paid out to shareholders. It’s not guaranteed and can change over time. (green). If dividends consistently exceed FCFFCF (Free Cash Flow)
Short for Free Cash Flow: cash left after operating needs and maintenance spending., the dividend may be at risk.
Analysis date: 2026-07-04
Disclaimer: This information is for educational purposes only. Not financial advice.