3 months Premium FREE
No credit card. No commitment.
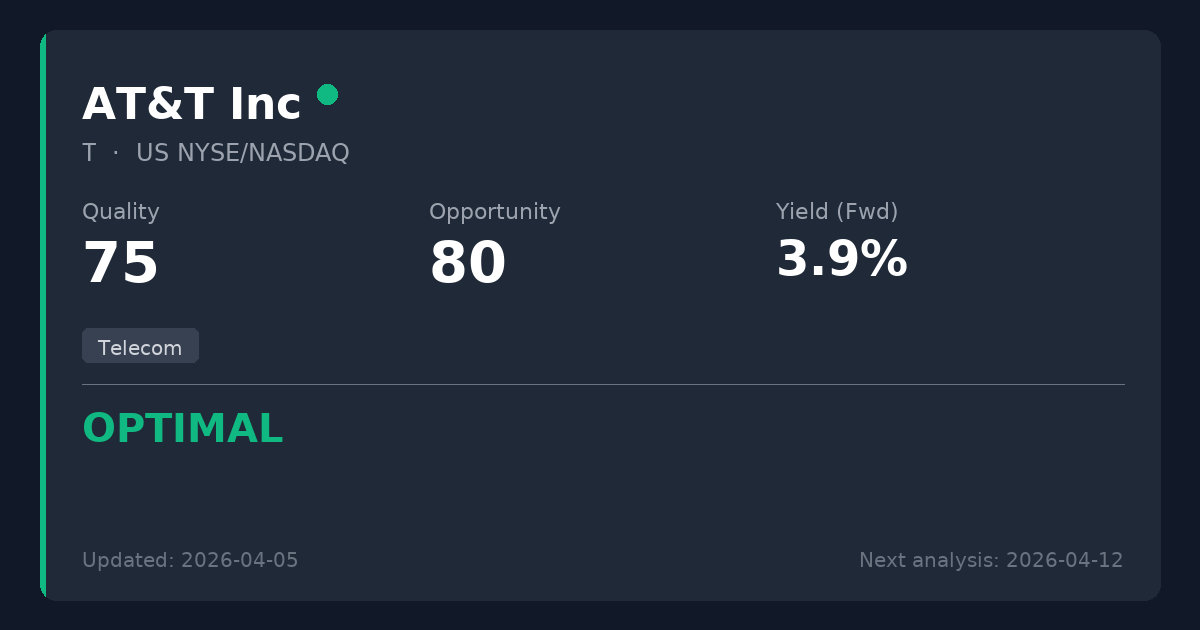
AT&T Inc.
🇺🇸 T · NYSE/NASDAQ · US00206R1023
Telecom
USD 20.53 price at analysis
Scores
Key Metrics
Powered by EODHDP/E (TTM)
6.9
P/E (Price-to-Earnings)Shows how much investors pay for each $1 of profit. We display the TTM P/E (Trailing Twelve Months) which uses actual earnings from the last 4 quarters. This is more reliable than Forward P/E which uses analyst estimates.
Calculation: 20.53 ÷ 2.99 = 6.9
TTM period through: 2026-03-31
Forward P/E (estimated): 8.9
Based on analyst estimates
Reference: Provider P/E (Trailing): 6.9
Net Debt/EBITDA (TTM)
2.8x
Latest quarter: 12.5x
Net Debt / EBITDAA leverage ratio showing how many years of EBITDA (earnings before interest, taxes, depreciation, and amortization) it would take to repay net debt. EBITDA approximates operating cash generation. Lower ratios (e.g., <3x) are generally safer; higher (e.g., >5x) may indicate more financial risk.
TTM through: 2026-03-31
Latest quarter (2026-03-31): 12.5x
The quarterly value can spike when quarterly EBITDA is very low (e.g., one-time charges).
Quick guide: <2x manageable, >4x can be risky (sector-dependent).
ROE
18.4%
ROE (Return on Equity)A profitability measure: how much profit is generated from shareholders’ equity. Higher isn’t always better if it comes from high debt.
EV/EBITDA
5.3x
EV/EBITDAA valuation ratio that compares total business value (including debt) to EBITDA. Lower can mean cheaper, but context matters.
Dividend Summary
Powered by EODHDDividend Yield (Fwd)
5.41%
TTM: 5.42%
Dividend YieldThe Forward yield (Fwd) shows the next announced annual dividend / current price — what you'd earn going forward. The Trailing yield (TTM) in the tooltip shows dividends actually paid in the last 12 months. Forward is shown as primary because it reflects the company's current commitment to shareholders.
Forward Yield (estimated): 5.41%
Trailing Yield (TTM, last 12 months): 5.42%
Payout Ratio (Fwd)
37.1%
TTM: 37.8%
Payout RatioDividends as a percentage of earnings. The Forward payout (Fwd) uses the announced dividend divided by actual past earnings (TTM) — it tells you if the company can afford what it promised. Very high payouts can be risky, especially if profits fall.
Announced dividend / actual earnings (TTM)
Payout (Fwd): 37.1%
Payout (TTM): 37.8%
Cash Flow Payout (TTM): 20.8%
FCF Coverage (TTM): 2.15x
Div. Growth (5Y)
-11.8%
Dividend History
EODHD Dividends API| Status | Type | Decl. Date | Ex-Div Date | Pay Date | Currency | Amount |
|---|---|---|---|---|---|---|
| Forecast* | Quarterly | — | 10 Apr 2027 | — | USD | 0.278 |
| Forecast* | Quarterly | — | 12 Jan 2027 | — | USD | 0.278 |
| Forecast* | Quarterly | — | 10 Oct 2026 | — | USD | 0.278 |
| Declared | Quarterly | 24 Jun 2026 | 10 Jul 2026 | 03 Aug 2026 | USD | 0.2775 |
| Paid | Quarterly | 27 Mar 2026 | 10 Apr 2026 | 01 May 2026 | USD | 0.278 |
| Paid | Quarterly | 15 Dec 2025 | 12 Jan 2026 | 02 Feb 2026 | USD | 0.278 |
| Paid | Quarterly | 25 Sep 2025 | 10 Oct 2025 | 03 Nov 2025 | USD | 0.278 |
| Paid | Quarterly | 25 Jun 2025 | 10 Jul 2025 | 01 Aug 2025 | USD | 0.278 |
* Extrapolated from past dividend history. Not an official announcement — treat as an estimate, not a confirmed date or amount.
Summary
AT&T operates a highly stable essential service oligopoly, providing critical mobile and broadband connectivity. Trading at $20.53, well below our P/FFO fair value estimate of $55.48-$83.21, this represents a substantial upside to fair value and is worth considering for new positions. The 5.4% dividend yield is exceptionally well-covered by free cash flow, and recent favorable regulatory rulings along with the dismissal of major legal overhangs significantly strengthen the long-term investment case.
Sector Context
AT&T is a dominant provider of essential mobile telecommunications and broadband internet services in the United States. In the telecom sector, massive infrastructure investments (like 5G and fiber) require elevated debt levels, but these create deep competitive moats and highly recurring revenues that are ideal for sustaining long-term dividend payouts.
Temporary Opportunity Identified
Market overreaction to a non-cash goodwill impairment charge in the legacy Business Wireline unit and past strategic dividend resets, obscuring strong underlying free cash flow generation and the resolution of major legal overhangs.
📊 Strategy Analysis
- • Trading at $20.53, significantly below the P/FFO fair value range of $55.48-$83.21, with a deeply discounted P/E (TTM) of 6.87x.
- • Highly secure 5.42% dividend yield, excellently covered by free cash flow (2.15x coverage ratio, 20.8% cash flow payout).
- • Favorable regulatory shifts, including the March 2026 FCC Network Modernization Order (facilitating profitable copper retirement) and the overturning of Title II Net Neutrality.
- • Major legal overhangs have been successfully resolved, including the dismissal of the lead-cable shareholder lawsuit and the capping of the 2024 data breach liabilities.
⚠ What to Watch
- • California Carrier of Last Resort (COLR) mandates continue to force the maintenance of unprofitable legacy copper networks, though AT&T is actively challenging this in federal court.
- • The legacy Business Wireline segment remains in secular decline, which previously triggered a $4.4 billion non-cash impairment charge.
- • While major shareholder and localized environmental suits regarding lead-sheathed cables were dismissed or settled, occupational hazard claims for utility workers remain an open-ended exposure.
📊 Historical Trends (10 Years)
Powered by EODHDThese charts show how key metrics have evolved over the past decade, helping you identify if the company is improving or deteriorating.
Debt Evolution (Net Debt / EBITDA)
Lower values are better. A declining trend indicates the company is reducing its debt (deleveraging).
Revenue & Earnings Growth
Consistent growth in revenueRevenue
The money a company brings in from selling its products or services. It’s the top line before costs. (blue) and earningsEarnings (Profit)
What’s left after expenses. Positive earnings mean the business made a profit; negative means a loss. (green) indicates a healthy business. Look for upward trends and recoveries after temporary dips.
Dividend Sustainability (FCF vs Dividends Paid)
Free cash flowFree Cash Flow
Cash left after the company pays for running the business and maintaining it. Often used to fund dividends, pay debt, or buy back shares. (FCFFCF (Free Cash Flow)
Short for Free Cash Flow: cash left after operating needs and maintenance spending., blue) should cover dividends paidDividends Paid
Cash the company paid out to shareholders. It’s not guaranteed and can change over time. (green). If dividends consistently exceed FCFFCF (Free Cash Flow)
Short for Free Cash Flow: cash left after operating needs and maintenance spending., the dividend may be at risk.
Analysis date: 2026-07-04
Disclaimer: This information is for educational purposes only. Not financial advice.