3 months Premium FREE
No credit card. No commitment.
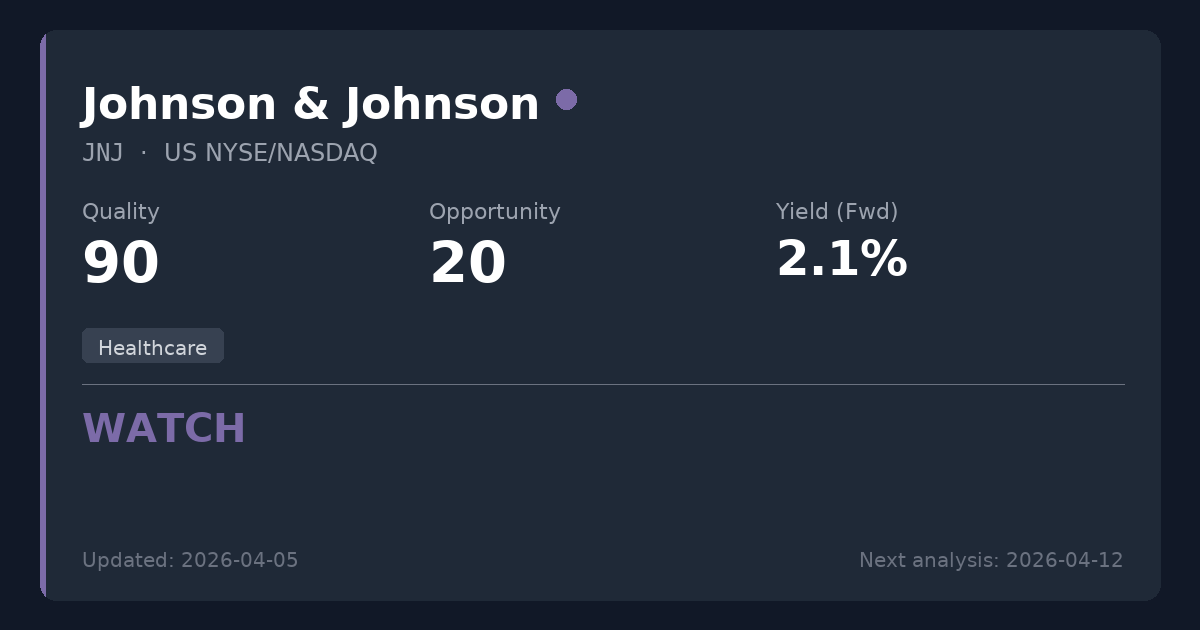
Johnson & Johnson
🇺🇸 JNJ · NYSE/NASDAQ · US4781601046
Healthcare
USD 258.51 price at analysis
Scores
Key Metrics
Powered by EODHDP/E (TTM)
29.9
P/E (Price-to-Earnings)Shows how much investors pay for each $1 of profit. We display the TTM P/E (Trailing Twelve Months) which uses actual earnings from the last 4 quarters. This is more reliable than Forward P/E which uses analyst estimates.
Calculation: 258.51 ÷ 8.65 = 29.9
TTM period through: 2026-03-31
Forward P/E (estimated): 21.9
Based on analyst estimates
Reference: Provider P/E (Trailing): 30.5
Net Debt/EBITDA (TTM)
1.0x
Latest quarter: 4.0x
Net Debt / EBITDAA leverage ratio showing how many years of EBITDA (earnings before interest, taxes, depreciation, and amortization) it would take to repay net debt. EBITDA approximates operating cash generation. Lower ratios (e.g., <3x) are generally safer; higher (e.g., >5x) may indicate more financial risk.
TTM through: 2026-03-31
Latest quarter (2026-03-31): 4.0x
The quarterly value can spike when quarterly EBITDA is very low (e.g., one-time charges).
Quick guide: <2x manageable, >4x can be risky (sector-dependent).
ROE
26.4%
ROE (Return on Equity)A profitability measure: how much profit is generated from shareholders’ equity. Higher isn’t always better if it comes from high debt.
EV/EBITDA
19.1x
EV/EBITDAA valuation ratio that compares total business value (including debt) to EBITDA. Lower can mean cheaper, but context matters.
Dividend Summary
Powered by EODHDDividend Yield (Fwd)
2.07%
TTM: 2.05%
Dividend YieldThe Forward yield (Fwd) shows the next announced annual dividend / current price — what you'd earn going forward. The Trailing yield (TTM) in the tooltip shows dividends actually paid in the last 12 months. Forward is shown as primary because it reflects the company's current commitment to shareholders.
Forward Yield (estimated): 2.07%
Trailing Yield (TTM, last 12 months): 2.05%
Payout Ratio (Fwd)
62.0%
TTM: 46.2%
Payout RatioDividends as a percentage of earnings. The Forward payout (Fwd) uses the announced dividend divided by actual past earnings (TTM) — it tells you if the company can afford what it promised. Very high payouts can be risky, especially if profits fall.
Announced dividend / actual earnings (TTM)
Payout (Fwd): 62.0%
Payout (TTM): 46.2%
Cash Flow Payout (TTM): 54.8%
FCF Coverage (TTM): 1.42x
Growth Streak
8 yrs
Consec. increases
Div. Growth (5Y)
5.2%
Dividend History
EODHD Dividends API| Status | Type | Decl. Date | Ex-Div Date | Pay Date | Currency | Amount |
|---|---|---|---|---|---|---|
| Forecast* | Quarterly | — | 26 May 2027 | — | USD | 1.34 |
| Forecast* | Quarterly | — | 24 Feb 2027 | — | USD | 1.3 |
| Forecast* | Quarterly | — | 25 Nov 2026 | — | USD | 1.3 |
| Forecast* | Quarterly | — | 26 Aug 2026 | — | USD | 1.3 |
| Paid | Quarterly | 14 Apr 2026 | 26 May 2026 | 09 Jun 2026 | USD | 1.34 |
| Paid | Quarterly | 02 Jan 2026 | 24 Feb 2026 | 10 Mar 2026 | USD | 1.3 |
| Paid | Quarterly | 14 Oct 2025 | 25 Nov 2025 | 09 Dec 2025 | USD | 1.3 |
| Paid | Quarterly | 16 Jul 2025 | 26 Aug 2025 | 09 Sep 2025 | USD | 1.3 |
* Extrapolated from past dividend history. Not an official announcement — treat as an estimate, not a confirmed date or amount.
Summary
Johnson & Johnson remains a defensive healthcare leader with an impeccable 64-year history of dividend growth and a fortress balance sheet. However, current valuation multiples are highly stretched (P/E ~30) and the 2.05% yield offers limited immediate income. Existing shareholders should maintain positions for stability, but new investors may want to monitor for a better entry point that provides a higher yield and margin of safety.
Sector Context
Johnson & Johnson is a diversified, premier global healthcare conglomerate that researches, develops, and manufactures pharmaceuticals and medical devices. In the healthcare sector, large-cap pharmaceutical companies face inherent long-term structural risks like patent cliffs and regulatory pricing pressures, making robust balance sheets and massive acquisition capabilities essential for sustaining long-term dividend growth.
📊 Strategy Analysis
- • Unparalleled financial scale with a AAA-rated balance sheet and strong Free Cash Flow covering the dividend with a safe 54.8% cash flow payout ratio.
- • Impeccable 64-year track record of consecutive dividend increases, cementing its position as a premier defensive dividend holding.
- • Massive scale and financial resources allow the company to aggressively acquire late-stage pipelines to offset incoming patent expirations.
⚠ What to Watch
- • Current valuation is highly stretched with a trailing P/E of 29.9, well above the strategy's target range of 8-15x and exceeding typical healthcare valuations.
- • The trailing dividend yield of 2.05% falls short of the minimum 3% threshold typically required for new income-focused positions.
- • Faces significant structural headwinds including patent cliffs for key blockbusters (Stelara, Xarelto), IRA Medicare price mandates implemented in 2026, and open-ended talc mass tort litigation.
📊 Historical Trends (10 Years)
Powered by EODHDThese charts show how key metrics have evolved over the past decade, helping you identify if the company is improving or deteriorating.
Debt Evolution (Net Debt / EBITDA)
Lower values are better. A declining trend indicates the company is reducing its debt (deleveraging).
Revenue & Earnings Growth
Consistent growth in revenueRevenue
The money a company brings in from selling its products or services. It’s the top line before costs. (blue) and earningsEarnings (Profit)
What’s left after expenses. Positive earnings mean the business made a profit; negative means a loss. (green) indicates a healthy business. Look for upward trends and recoveries after temporary dips.
Dividend Sustainability (FCF vs Dividends Paid)
Free cash flowFree Cash Flow
Cash left after the company pays for running the business and maintaining it. Often used to fund dividends, pay debt, or buy back shares. (FCFFCF (Free Cash Flow)
Short for Free Cash Flow: cash left after operating needs and maintenance spending., blue) should cover dividends paidDividends Paid
Cash the company paid out to shareholders. It’s not guaranteed and can change over time. (green). If dividends consistently exceed FCFFCF (Free Cash Flow)
Short for Free Cash Flow: cash left after operating needs and maintenance spending., the dividend may be at risk.
Analysis date: 2026-07-04
Disclaimer: This information is for educational purposes only. Not financial advice.