3 months Premium FREE
No credit card. No commitment.
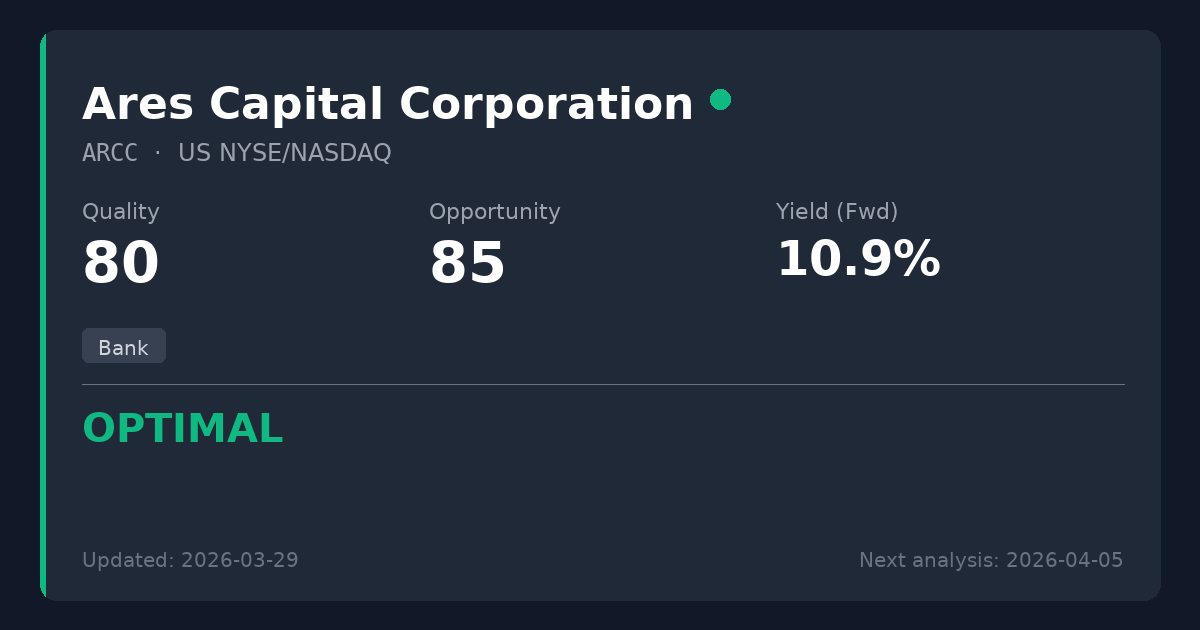
Ares Capital Corporation
🇺🇸 ARCC · NYSE/NASDAQ · US04010L1035
Bank
USD 18.70 price at analysis
Scores
Key Metrics
Powered by EODHDP/E (TTM)
11.4
P/E (Price-to-Earnings)Shows how much investors pay for each $1 of profit. We display the TTM P/E (Trailing Twelve Months) which uses actual earnings from the last 4 quarters. This is more reliable than Forward P/E which uses analyst estimates.
Calculation: 18.70 ÷ 1.64 = 11.4
TTM period through: 2026-03-31
Forward P/E (estimated): 9.5
Based on analyst estimates
Reference: Provider P/E (Trailing): 11.5
Net Debt/EBITDA (TTM)
7.5x
Latest quarter: 21.6x
Net Debt / EBITDAA leverage ratio showing how many years of EBITDA (earnings before interest, taxes, depreciation, and amortization) it would take to repay net debt. EBITDA approximates operating cash generation. Lower ratios (e.g., <3x) are generally safer; higher (e.g., >5x) may indicate more financial risk.
TTM through: 2026-03-31
Latest quarter (2026-03-31): 21.6x
The quarterly value can spike when quarterly EBITDA is very low (e.g., one-time charges).
Quick guide: <2x manageable, >4x can be risky (sector-dependent).
ROE
8.3%
ROE (Return on Equity)A profitability measure: how much profit is generated from shareholders’ equity. Higher isn’t always better if it comes from high debt.
EV/EBITDA
10.2x
EV/EBITDAA valuation ratio that compares total business value (including debt) to EBITDA. Lower can mean cheaper, but context matters.
Dividend Summary
Powered by EODHDDividend Yield (Fwd)
10.27%
TTM: 10.29%
Dividend YieldThe Forward yield (Fwd) shows the next announced annual dividend / current price — what you'd earn going forward. The Trailing yield (TTM) in the tooltip shows dividends actually paid in the last 12 months. Forward is shown as primary because it reflects the company's current commitment to shareholders.
Forward Yield (estimated): 10.27%
Trailing Yield (TTM, last 12 months): 10.29%
Payout Ratio (Fwd)
117.3%
TTM: 113.1%
Payout RatioDividends as a percentage of earnings. The Forward payout (Fwd) uses the announced dividend divided by actual past earnings (TTM) — it tells you if the company can afford what it promised. Very high payouts can be risky, especially if profits fall.
Announced dividend / actual earnings (TTM)
Payout (Fwd): 117.3%
Payout (TTM): 113.1%
Cash Flow Payout (TTM): 121.1%
FCF Coverage (TTM): 0.83x
Div. Growth (5Y)
3.7%
Dividend History
EODHD Dividends API| Status | Type | Decl. Date | Ex-Div Date | Pay Date | Currency | Amount |
|---|---|---|---|---|---|---|
| Forecast* | Quarterly | — | 15 Jun 2027 | — | USD | 0.48 |
| Forecast* | Quarterly | — | 13 Mar 2027 | — | USD | 0.48 |
| Forecast* | Quarterly | — | 15 Dec 2026 | — | USD | 0.48 |
| Forecast* | Quarterly | — | 15 Sep 2026 | — | USD | 0.48 |
| Paid | Quarterly | 28 Apr 2026 | 15 Jun 2026 | 30 Jun 2026 | USD | 0.48 |
| Paid | Quarterly | 04 Feb 2026 | 13 Mar 2026 | 31 Mar 2026 | USD | 0.48 |
| Paid | Quarterly | 28 Oct 2025 | 15 Dec 2025 | 30 Dec 2025 | USD | 0.48 |
| Paid | Quarterly | 29 Jul 2025 | 15 Sep 2025 | 30 Sep 2025 | USD | 0.48 |
* Extrapolated from past dividend history. Not an official announcement — treat as an estimate, not a confirmed date or amount.
Summary
Ares Capital is the industry's premier business development company, providing direct lending to middle-market businesses and capitalizing on structural shifts as traditional banks retreat from this space. Trading at $18.70, the stock sits below its NAV fair value of $19.59, representing an attractive entry point for income-focused investors. Worth considering for new positions, offering a historically reliable 10.3% yield while the core business benefits from a 'higher-for-longer' interest rate environment and a robust balance sheet.
Sector Context
Ares Capital operates as a Business Development Company (BDC), providing debt and equity financing to U.S. middle-market businesses. As a BDC, ARCC is legally required to distribute at least 90% of its taxable income to shareholders, making payout ratios near 100% standard rather than a warning sign. The company benefits enormously from structural tailwinds, as stringent Basel III capital requirements increasingly force traditional commercial banks to abandon direct leveraged lending, effectively handing market share to BDCs with permanent, non-redeemable capital.
Temporary Opportunity Identified
Fears of falling interest rates compressing net investment income, combined with recent derivative litigation over asset valuations and a slight Q1 earnings lag, have temporarily pressured the stock below NAV.
📊 Strategy Analysis
- • Trading at $18.70, below its Net Asset Value (NAV) of $19.59 (a 4.5% discount), offering a margin of safety and upside potential to its asset-backed fair value.
- • As the largest publicly traded BDC, ARCC benefits from significant structural tailwinds as strict Basel III capital rules force traditional commercial banks out of middle-market lending.
- • Offers a highly attractive 10.3% dividend yield backed by a 10-year track record of zero cuts, supported by a permanent capital structure that immunizes it from retail redemption runs.
- • The Federal Reserve's recent 'higher-for-longer' interest rate stance provides near-term support for ARCC's predominantly floating-rate loan portfolio, mitigating immediate net investment income compression risks.
⚠ What to Watch
- • Recent core earnings slightly lagged the dividend distribution (Q1 EPS of $0.47 vs. $0.48 dividend), resulting in a tight Free Cash Flow coverage ratio of 0.83x.
- • Ongoing derivative litigation concerning the valuation marks on illiquid Level 3 assets and advisory fees introduces headline noise and potential regulatory risk.
📊 Historical Trends (10 Years)
Powered by EODHDThese charts show how key metrics have evolved over the past decade, helping you identify if the company is improving or deteriorating.
Debt Evolution (Net Debt / EBITDA)
Lower values are better. A declining trend indicates the company is reducing its debt (deleveraging).
Revenue & Earnings Growth
Consistent growth in revenueRevenue
The money a company brings in from selling its products or services. It’s the top line before costs. (blue) and earningsEarnings (Profit)
What’s left after expenses. Positive earnings mean the business made a profit; negative means a loss. (green) indicates a healthy business. Look for upward trends and recoveries after temporary dips.
Dividend Sustainability (FCF vs Dividends Paid)
Free cash flowFree Cash Flow
Cash left after the company pays for running the business and maintaining it. Often used to fund dividends, pay debt, or buy back shares. (FCFFCF (Free Cash Flow)
Short for Free Cash Flow: cash left after operating needs and maintenance spending., blue) should cover dividends paidDividends Paid
Cash the company paid out to shareholders. It’s not guaranteed and can change over time. (green). If dividends consistently exceed FCFFCF (Free Cash Flow)
Short for Free Cash Flow: cash left after operating needs and maintenance spending., the dividend may be at risk.
Analysis date: 2026-07-04
Disclaimer: This information is for educational purposes only. Not financial advice.