3 months Premium FREE
No credit card. No commitment.
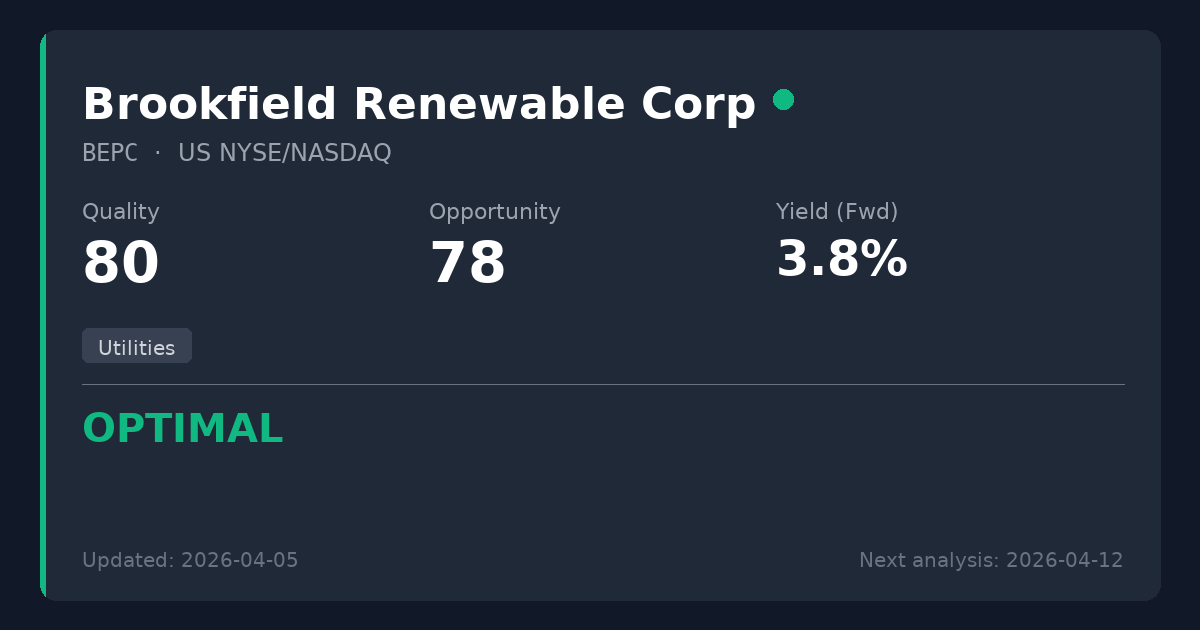
Brookfield Renewable Corp
🇺🇸 BEPC · NYSE/NASDAQ · CA11284V1058
Utilities
USD 36.62 price at analysis
Scores
Key Metrics
Powered by EODHDP/E (TTM)
N/A
P/E (Price-to-Earnings)Shows how much investors pay for each $1 of profit. We display the TTM P/E (Trailing Twelve Months) which uses actual earnings from the last 4 quarters. This is more reliable than Forward P/E which uses analyst estimates.
TTM period through: 2026-03-31
Why N/A?
EPS (TTM) = -29.51 (negative or zero)
Cannot calculate P/E with negative earnings.
Forward P/E (estimated): 14.6
Based on analyst estimates
Reference: Provider P/E (Forward): 14.6
ROE
-47.8%
ROE (Return on Equity)A profitability measure: how much profit is generated from shareholders’ equity. Higher isn’t always better if it comes from high debt.
EV/EBITDA
38.2x
EV/EBITDAA valuation ratio that compares total business value (including debt) to EBITDA. Lower can mean cheaper, but context matters.
Dividend Summary
Powered by EODHDDividend Yield (Fwd)
4.29%
TTM: 4.30%
Dividend YieldThe Forward yield (Fwd) shows the next announced annual dividend / current price — what you'd earn going forward. The Trailing yield (TTM) in the tooltip shows dividends actually paid in the last 12 months. Forward is shown as primary because it reflects the company's current commitment to shareholders.
Forward Yield (estimated): 4.29%
Trailing Yield (TTM, last 12 months): 4.30%
Payout Ratio (Fwd)
0.1% TTM
Payout RatioDividends as a percentage of earnings. The Forward payout (Fwd) uses the announced dividend divided by actual past earnings (TTM) — it tells you if the company can afford what it promised. Very high payouts can be risky, especially if profits fall.
Announced dividend / actual earnings (TTM)
Cash Flow Payout (TTM): 1.0%
FCF Coverage (TTM): -126.60x
Growth Streak
4 yrs
Consec. increases
Dividend History
EODHD Dividends API| Status | Type | Decl. Date | Ex-Div Date | Pay Date | Currency | Amount |
|---|---|---|---|---|---|---|
| Forecast* | Quarterly | — | 29 May 2027 | — | USD | 0.392 |
| Forecast* | Quarterly | — | 27 Feb 2027 | — | USD | 0.392 |
| Forecast* | Quarterly | — | 28 Nov 2026 | — | USD | 0.373 |
| Forecast* | Quarterly | — | 29 Aug 2026 | — | USD | 0.373 |
| Paid | Quarterly | 30 Apr 2026 | 29 May 2026 | 30 Jun 2026 | USD | 0.392 |
| Paid | Quarterly | 30 Jan 2026 | 27 Feb 2026 | 31 Mar 2026 | USD | 0.392 |
| Paid | Quarterly | 05 Nov 2025 | 28 Nov 2025 | 31 Dec 2025 | USD | 0.373 |
| Paid | Quarterly | 01 Aug 2025 | 29 Aug 2025 | 30 Sep 2025 | USD | 0.373 |
* Extrapolated from past dividend history. Not an official announcement — treat as an estimate, not a confirmed date or amount.
Summary
Brookfield Renewable Corp offers premier global renewable energy infrastructure backed by highly predictable contracted cash flows. The recent headline GAAP net losses are temporary accounting anomalies related to non-cash share remeasurements, which mask strong underlying Funds From Operations (FFO) growth. Trading at $36.62 vs fair value of $301-452 (derived from an exceptionally low P/FFO of 1.46x), it represents massive upside potential to fair value. Worth considering for new positions at current levels, offering an attractive 4.3% yield while waiting for price appreciation.
Sector Context
Brookfield Renewable Corp operates one of the world's largest publicly traded, pure-play renewable power platforms, generating electricity through hydroelectric, wind, and solar facilities globally. In the capital-intensive utility and infrastructure sectors, traditional GAAP earnings are often distorted by heavy depreciation and non-cash liabilities; therefore, P/FFO (Price to Funds From Operations) is the critical metric to assess true cash-generating power and dividend sustainability.
Temporary Opportunity Identified
Headline GAAP net losses are driven entirely by non-cash accounting adjustments—specifically heavy depreciation and the remeasurement of BEPC exchangeable shares as financial liabilities—which mask actual, growing operational cash flows (FFO).
📊 Strategy Analysis
- • Trading at $36.62, significantly below the fair value range of $301.2 - $451.8 USD based on its extraordinary cash generation.
- • GAAP net losses are an accounting artifact (non-cash share remeasurements and depreciation), while actual P/FFO sits at an exceptionally cheap 1.46x.
- • Reliable 4.3% dividend yield with a 5.3% CAGR and 4 consecutive years of growth, fully supported by underlying Funds From Operations.
- • Premium global portfolio of contracted renewable power assets provides highly visible, inflation-linked cash flows.
⚠ What to Watch
- • Net Debt/EBITDA of 36.6x is optically extreme and exceeds standard thresholds, requiring careful monitoring despite being characteristic of Brookfield's non-recourse structure.
- • Long-term structural asset limits exist, including 35-year fixed-term wind/solar authorizations without renewal rights and Brazilian hydroelectric concessions lacking terminal value.
- • Operational and regulatory risks persist from ongoing litigation, notably the $100 million Mississagi River lawsuit and environmental blockades against Kennebec River dam relicensing.
📊 Historical Trends (10 Years)
Powered by EODHDThese charts show how key metrics have evolved over the past decade, helping you identify if the company is improving or deteriorating.
Debt Evolution (Net Debt / EBITDA)
Lower values are better. A declining trend indicates the company is reducing its debt (deleveraging).
Revenue & Earnings Growth
Consistent growth in revenueRevenue
The money a company brings in from selling its products or services. It’s the top line before costs. (blue) and earningsEarnings (Profit)
What’s left after expenses. Positive earnings mean the business made a profit; negative means a loss. (green) indicates a healthy business. Look for upward trends and recoveries after temporary dips.
Dividend Sustainability (FCF vs Dividends Paid)
Free cash flowFree Cash Flow
Cash left after the company pays for running the business and maintaining it. Often used to fund dividends, pay debt, or buy back shares. (FCFFCF (Free Cash Flow)
Short for Free Cash Flow: cash left after operating needs and maintenance spending., blue) should cover dividends paidDividends Paid
Cash the company paid out to shareholders. It’s not guaranteed and can change over time. (green). If dividends consistently exceed FCFFCF (Free Cash Flow)
Short for Free Cash Flow: cash left after operating needs and maintenance spending., the dividend may be at risk.
Analysis date: 2026-07-04
Disclaimer: This information is for educational purposes only. Not financial advice.